
16th and 27th September 2002 at Lerwick
The figures below show the ozone anomaly map as reported by Northern Hemisphere ground based instruments. Anomalous low ozone values of up to 20% lower than the long-term mean were observed in Northern Europe on both days. However, the global structure of the anomaly is somewhat different. There is a clear planetary wave pattern visible on the 27th but only a dipole structure (high values over Central Europe) on the 16th. Comparison with TOMS on the relevant days shows some discrepancy with the ground based reporting 226 and 229 DU versus TOMS of 253 and 245 DU on the 16th and 27th respectively. As noted before TOMS appears to be reporting significantly higher values than the ground-based station. However, inspection of the TOMS map for the relevant days does show low ozone values over Northern Europe for both days. It is plausible that the viewing average of TOMS continues to under report the severity of local fluctuations.
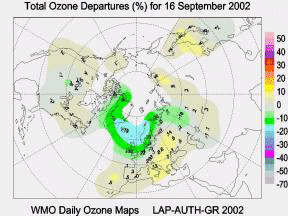
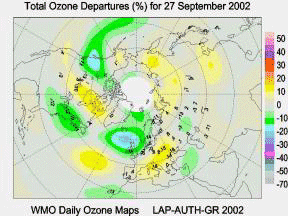
Ozone Anomaly Maps for the Low Ozone Events Occurring on 16th September 2002 (left-hand panel) and 27th September 2002 (right-hand panel), as reported by Ground-based Instruments.
The figures above show the tropopause pressure for the 16th and 27th September, as reported by the Global Data Assimilation System. Low tropopause pressures are evident over the same region as for the reported low ozone anomalies. These low values indicate low stratospheric mass and therefore low column ozone are very likely. There is a global wave-like structure with tropopause increases and decreases around middle latitudes. Particularly interesting to note is the low pressure anomaly over the East Pacific on the 27th September. This may suggest that the origin of the most recent event could be linked to the developing El Niño in the Pacific, and the northward propagation of Rossby waves caused by tropical heating anomalies. These waves can modify the jet stream. Figure 4.10 Maps of the Tropopause Pressure for the Low Ozone Events Occurring on 16th September 2002 (left-hand panel) and 27th September 2002 (right-hand panel). Concurrent with the low troposphere pressure anomaly is a surface blocking anti-cyclone giving a prolonged dry spell during September. As an anomalous high tropopause pressure in the south over the Atlantic (e.g. the Azores) was evident, it would be reasonable to conclude that the origin of both disturbances is in the tropics (low latitudes) and that the signature of this disturbance then spans the middle latitudes across the globe. It would appear that the position of this planetary wave will have a critical influence on whether the UK experiences a low ozone event or not. The wind fields at 100 mb for these days showed that there was a southerly flow over Lerwick on the 27th September, but northerly flow on the 16th September. The southerly flow will advect low ozone from lower latitudes and reduce the ozone column and thus further enhance the tropopause effect discussed above. However, the northerly flow would tend to have the opposite effect. It therefore seems that the dominant effect is the modification of the tropopause pressure and not advection. There is thus a reasonable dynamic explanation for both of these low ozone events.
The figures below show the ozone anomaly map as reported by Northern Hemisphere ground based instruments. Anomalous low ozone values of up to 20% lower than the long-term mean were observed in Northern Europe on both days. However, the global structure of the anomaly is somewhat different. There is a clear planetary wave pattern visible on the 27th but only a dipole structure (high values over Central Europe) on the 16th. Comparison with TOMS on the relevant days shows some discrepancy with the ground based reporting 226 and 229 DU versus TOMS of 253 and 245 DU on the 16th and 27th respectively. As noted before TOMS appears to be reporting significantly higher values than the ground-based station. However, inspection of the TOMS map for the relevant days does show low ozone values over Northern Europe for both days. It is plausible that the viewing average of TOMS continues to under report the severity of local fluctuations.
Ozone Anomaly Maps for the Low Ozone Events Occurring on 16th September 2002 (left-hand panel) and 27th September 2002 (right-hand panel), as reported by Ground-based Instruments.
The figures above show the tropopause pressure for the 16th and 27th September, as reported by the Global Data Assimilation System. Low tropopause pressures are evident over the same region as for the reported low ozone anomalies. These low values indicate low stratospheric mass and therefore low column ozone are very likely. There is a global wave-like structure with tropopause increases and decreases around middle latitudes. Particularly interesting to note is the low pressure anomaly over the East Pacific on the 27th September. This may suggest that the origin of the most recent event could be linked to the developing El Niño in the Pacific, and the northward propagation of Rossby waves caused by tropical heating anomalies. These waves can modify the jet stream. Figure 4.10 Maps of the Tropopause Pressure for the Low Ozone Events Occurring on 16th September 2002 (left-hand panel) and 27th September 2002 (right-hand panel). Concurrent with the low troposphere pressure anomaly is a surface blocking anti-cyclone giving a prolonged dry spell during September. As an anomalous high tropopause pressure in the south over the Atlantic (e.g. the Azores) was evident, it would be reasonable to conclude that the origin of both disturbances is in the tropics (low latitudes) and that the signature of this disturbance then spans the middle latitudes across the globe. It would appear that the position of this planetary wave will have a critical influence on whether the UK experiences a low ozone event or not. The wind fields at 100 mb for these days showed that there was a southerly flow over Lerwick on the 27th September, but northerly flow on the 16th September. The southerly flow will advect low ozone from lower latitudes and reduce the ozone column and thus further enhance the tropopause effect discussed above. However, the northerly flow would tend to have the opposite effect. It therefore seems that the dominant effect is the modification of the tropopause pressure and not advection. There is thus a reasonable dynamic explanation for both of these low ozone events.