
The UV Index and data quality flags
What is the UV Index?
The UV Index (UVI) is a measure of solar UV radiation at the Earth’s surface in terms of potential damage to the skin and the eye. Higher the UVI, less time it takes for harm to occur.
Short exposures to solar UV radiation to generate vitamin D are OK but it is important not to get sunburnt.
Looking at the UVI is a good way of deciding whether or not protection from the sun is needed on a particular day. For most people, a UV Index of 1 or 2 is safe but for a UV Index of 3 or above protection is recommended. The highest UVI in the UK is approximately 8.
Measurements of total UV radiation are made over the range 290 - 400 nm, either by broadband or spectral instruments.
Defra funds spectral UV monitoring at Reading and Public Health England (PHE) operates a network of nine broadband UV monitoring stations. All instruments provide data suitable for calculating the UVI in near-real-time.
» View the interactive UV monitoring graphs for sites in the UK
The measured intensities are converted to irradiance values in W/m2 and then into a UV Index value for public information reporting. Further information can be found on the WHO website.
The maximum UVI in mid-summer in the UK is 8 (occasionally reached at the monitoring station in Camborne). However, UK citizens going overseas need to be aware that the UVI may be much higher, for example in Australia.
For spectral data the CIE Action Spectrum has to be applied over the wavelength range in order to convert measured irradiance to a measure of health-risk. The CIE spectrum is one of a number of models for the susceptibility of the caucasian skin to sunburn (erythema). The erythemally weighted data are then summed across the wavelengths to provide the Total UV index.
Figure 1 below shows how the most significant effects are at the lower wavelength range once the intensities have been erithemally weighted. Without erithemal weighting irradiance basically increases as you scan across the wavelengths.
What is erythema and erythemal UV?
The erythemal UV indicates the sunburning power of the radiation and is represented by:
Where Eλ is the spectrum of the radiation (e.g. the sun), Aλ is the erythemal action spectrum, and λ is wavelength
Figure 1: Measured UV irradiance converted to erythemal UV irradiance using the CIE action spectrum

Data Quality Flags
Various data checks and processes are applied to the spectral UV monitoring data before they are finalised.
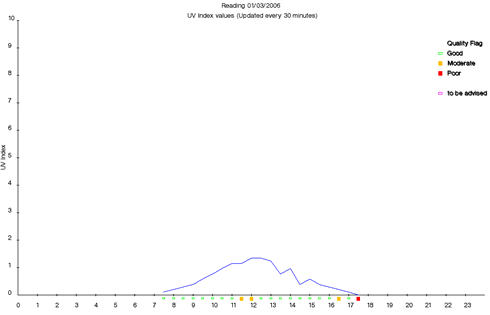
Firstly, providing that the instrument is operating correctly within calibration, results of the 30 minute spectral scans are automatically uploaded to this web site as provisional Solar UV Index results on a daily basis. These are available in a tabular form and as daily UV index graphs clearly flagged as "Provisional" data.
Example of daily UV Index graph
On a daily basis further quality checks are carried out by Manchester University. These involve both manual inspection of the data and use of the SHICRIVM software. The SHICRIVM outputs a set of data flags which are then used to assign a data quality level of "Good", "Moderate" or "Poor" to the results. The assessment of quality is based on diagnosis a number of criteria in the UV spectra such as light level, spikes and local anomalies. If the reviewed data set and associated quality flags are both available then the data are published on this web site as ratified with appropriate flagging information attached.
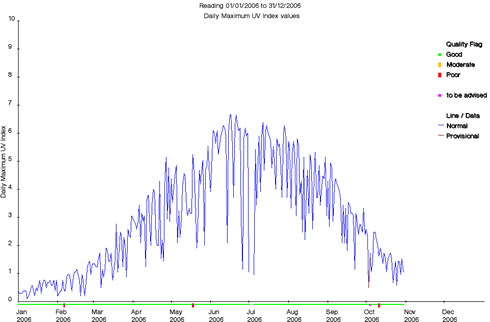
A quality flag is assigned to each individual spectral scan, and to the overall daily maximum Solar UV index value, based on the percentage of "good" values in each data set. The quality flags are presented alongside the graphs of daily and annual Solar UV index for the Reading monitoring site.
Example of Annual Solar UV Index graph with Quality Flags
Only the ratified raw spectral data are made available for download by researchers from this web site. Measurements are carried out by Dr. Ann Webb and her team at the University of Manchester under a Defra funded contract. If the data are downloaded for research purposes, then an acknowledgement of the project team and funding source (Defra) would be appreciated.