June 2002
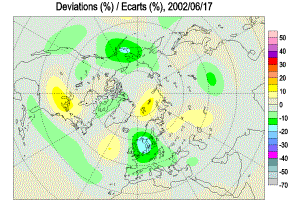
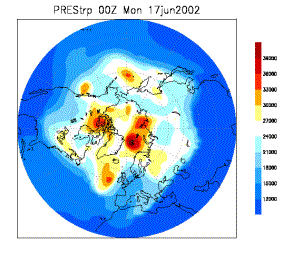
The left-hand panel below shows the ozone anomaly map as reported by Northern Hemisphere ground based instruments. Anomalous low ozone values of up to 20% lower than the long-term mean were observed in Northern Europe and appear centred over the North Sea. Lerwick reported a value of 296 DU, which was a high quality direct sun and blue zenith measurements. At local noon TOMS reported a value of 303 DU over Lerwick. As stated above, the ground-based value is lower than that reported by TOMS. Inspection of the TOMS global map on this day does not show any distinctive pattern. There are ongoing calibration problems with the TOMS instrument with may introduce errors of up to 5%. Inspection of the meteorological analysis reveals a likely dynamic origin of the reported low ozone event. The right-hand panel below shows the tropopause pressure for the 17th June, as reported by the Global Data Assimilation System. Low tropopause pressures are evident over the same region as for the reported low ozone anomalies. These low values indicate low stratospheric mass and therefore low column ozone are very likely. The wind field at 100 mb for this day provided evidence for a significant southerly flow into the North Sea. This will advect low ozone from low latitudes and reduce the ozone column and thus enhance the tropopause effect discussed above. In conclusion, there is a reasonable dynamic explanation of this event.


Maps of (a) the Ozone Anomaly for the Low Ozone Event Occurring on 17th June 2002 (left-hand panel) and (b) the Tropopause Pressure (right-hand panel).


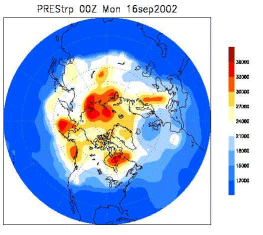
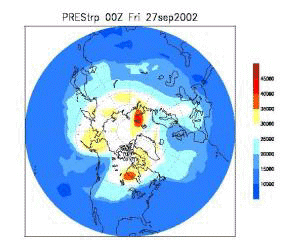
Maps of the Tropopause Pressure for the Low Ozone Events Occurring on 16th September 2002 (left-hand panel) and 27th September 2002 (right-hand panel)
The left-hand panel below shows the ozone anomaly map as reported by Northern Hemisphere ground based instruments. Anomalous low ozone values of up to 20% lower than the long-term mean were observed in Northern Europe and appear centred over the North Sea. Lerwick reported a value of 296 DU, which was a high quality direct sun and blue zenith measurements. At local noon TOMS reported a value of 303 DU over Lerwick. As stated above, the ground-based value is lower than that reported by TOMS. Inspection of the TOMS global map on this day does not show any distinctive pattern. There are ongoing calibration problems with the TOMS instrument with may introduce errors of up to 5%. Inspection of the meteorological analysis reveals a likely dynamic origin of the reported low ozone event. The right-hand panel below shows the tropopause pressure for the 17th June, as reported by the Global Data Assimilation System. Low tropopause pressures are evident over the same region as for the reported low ozone anomalies. These low values indicate low stratospheric mass and therefore low column ozone are very likely. The wind field at 100 mb for this day provided evidence for a significant southerly flow into the North Sea. This will advect low ozone from low latitudes and reduce the ozone column and thus enhance the tropopause effect discussed above. In conclusion, there is a reasonable dynamic explanation of this event.


Maps of (a) the Ozone Anomaly for the Low Ozone Event Occurring on 17th June 2002 (left-hand panel) and (b) the Tropopause Pressure (right-hand panel).


Maps of the Tropopause Pressure for the Low Ozone Events Occurring on 16th September 2002 (left-hand panel) and 27th September 2002 (right-hand panel)
