
February 2008
This event was intermittently recorded between the 15th and the 21st February covering much of the UK. Figure A shows the scale of the event on the 18th and 21st. During this the troposphere geopotential height anomaly shows a wave number one structure i.e. high in western hemisphere and low in the eastern hemisphere (Figure B). Anti-cyclonic conditions favour low ozone events because of tropopause lifting. In this case the UK was part of planetary pressure wave anomaly which may explain the longer than typical duration. The anti-cyclone also moved back and forwards which is characteristic of planetary event rather than a smaller anomaly which is mostly advected eastwards. It is likely that some of the ozone loss is due to chemistry. During this period threshold temperatures in the stratosphere to form polar stratospheric clouds were met over large areas of Northern Scandinavia. These clouds provide surfaces for chlorine activation and hence ozone destruction. Although the stratospheric flow was predominately from the north west (i.e. not directly from the region of the coldest temperatures), it is possible that some ozone depletion would have recirculated to enhance the dynamic loss. The dynamic loss mechanism is the dominant cause of this event.
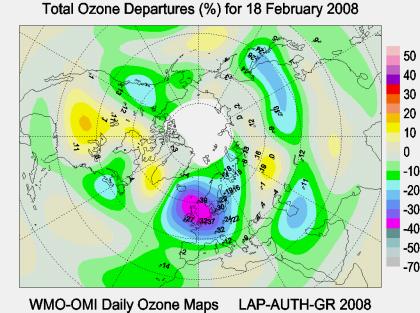
Figure A: Ozone anomaly composite map of satellite and ground based anomaly (%) for the 18th February 2008 which was part of an extended low ozone phase.
Figure B: 200 hPa Geopotential Height anomaly for the 18th February 2008. the figure shows high a wave number one type structure with high anomalies in the western hemisphere and low anomalies on the eastern hemisphere.
This event was intermittently recorded between the 15th and the 21st February covering much of the UK. Figure A shows the scale of the event on the 18th and 21st. During this the troposphere geopotential height anomaly shows a wave number one structure i.e. high in western hemisphere and low in the eastern hemisphere (Figure B). Anti-cyclonic conditions favour low ozone events because of tropopause lifting. In this case the UK was part of planetary pressure wave anomaly which may explain the longer than typical duration. The anti-cyclone also moved back and forwards which is characteristic of planetary event rather than a smaller anomaly which is mostly advected eastwards. It is likely that some of the ozone loss is due to chemistry. During this period threshold temperatures in the stratosphere to form polar stratospheric clouds were met over large areas of Northern Scandinavia. These clouds provide surfaces for chlorine activation and hence ozone destruction. Although the stratospheric flow was predominately from the north west (i.e. not directly from the region of the coldest temperatures), it is possible that some ozone depletion would have recirculated to enhance the dynamic loss. The dynamic loss mechanism is the dominant cause of this event.
Figure A: Ozone anomaly composite map of satellite and ground based anomaly (%) for the 18th February 2008 which was part of an extended low ozone phase.
Figure B: 200 hPa Geopotential Height anomaly for the 18th February 2008. the figure shows high a wave number one type structure with high anomalies in the western hemisphere and low anomalies on the eastern hemisphere.