
July 2009
The event was caused by exceptionally warm weather due to tropospheric anticyclone, and this advected warm air from the south and lifting the tropopause thus reducing the ozone column locally. The event was centred over UK and Scandinavia as demonstrated by the satellite maps (Figure A). Note there was a simultaneous low ozone anomaly near New Foundland.
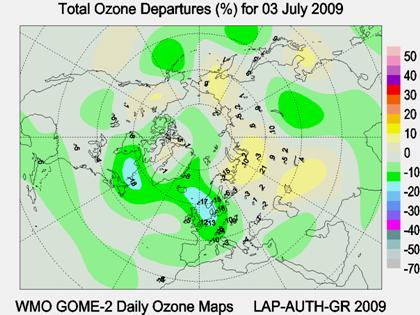
Figure A: Ozone anomaly maps during the peak of the ozone event on 3rd July.
Examination of the Northern Hemisphere geopotential maps reveals that this event was part of a relatively low wave number 4 disturbance (Figure B).
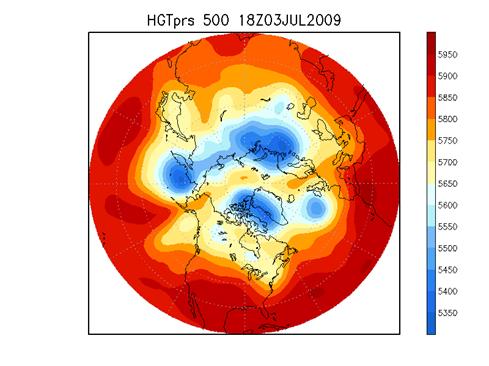
Figure B: Geopotential height (m) at 500 hPa for the 3rd July.
These hemispheric wide upper level pressure wave patterns tend to be slow moving and quasi-stationary which accounts for the relatively long duration (3 days) of this event. In final stages the low ozone anomaly moved into Central Europe (5th July). These types of low wave number disturbances are unusual at this time of year.
The UK data agree well with the pattern observed at other nearby monitoring locations, and that the low centre moved away to the north-east, clearing the Valentia monitoring station in southern Ireland first. Low ozone alerts were recorded on four consecutive days during the period, three from the Dobson instrument at Lerwick and a later one from the Brewer instrument at Reading.
Data from the OMI satellite showed a similar decline to the ground-based monitoring stations but were consistently lower than both the Dobson and the Brewer measurements, indicating a possible systematic bias in the satellite results (there are recent reports of some loose material on the satellite possibly interfering with measurements). Note that there are also differences between satellites as for example GOME appears to show lower values early on than the OMI.
The event was caused by exceptionally warm weather due to tropospheric anticyclone, and this advected warm air from the south and lifting the tropopause thus reducing the ozone column locally. The event was centred over UK and Scandinavia as demonstrated by the satellite maps (Figure A). Note there was a simultaneous low ozone anomaly near New Foundland.
Figure A: Ozone anomaly maps during the peak of the ozone event on 3rd July.
Examination of the Northern Hemisphere geopotential maps reveals that this event was part of a relatively low wave number 4 disturbance (Figure B).
Figure B: Geopotential height (m) at 500 hPa for the 3rd July.
These hemispheric wide upper level pressure wave patterns tend to be slow moving and quasi-stationary which accounts for the relatively long duration (3 days) of this event. In final stages the low ozone anomaly moved into Central Europe (5th July). These types of low wave number disturbances are unusual at this time of year.
The UK data agree well with the pattern observed at other nearby monitoring locations, and that the low centre moved away to the north-east, clearing the Valentia monitoring station in southern Ireland first. Low ozone alerts were recorded on four consecutive days during the period, three from the Dobson instrument at Lerwick and a later one from the Brewer instrument at Reading.
Data from the OMI satellite showed a similar decline to the ground-based monitoring stations but were consistently lower than both the Dobson and the Brewer measurements, indicating a possible systematic bias in the satellite results (there are recent reports of some loose material on the satellite possibly interfering with measurements). Note that there are also differences between satellites as for example GOME appears to show lower values early on than the OMI.