
October 2007
The event centred on the 21st of October was particularly severe with a daily averaged column reported of 189 DU. This was the lowest recorded ozone column for over 40 years at Lerwick and is similar to Antarctic Ozone hole levels. However, the corresponding satellite OMI overpass observation for that day was 220 DU. This discrepancy of 16% is too large to be explained by instrument noise and more likely due to differences in the data reduction polynomials. There is however no doubt that there was a mini hole over Lerwick at this time.
This event commenced as a relatively small mini-hole near Iceland on the 17th October. This is a frequent zone of the genesis of mini-holes that arrive over Lerwick. This anomaly was then advected towards Lerwick and became stationary and intensified over Lerwick and Scandinavia until the 24th October. It did not cover much of the UK as can be seen by the map (Figure A) and this is confirmed by unremarkable ozone columns at Manchester and Reading.
Figure A: Total Ozone Departures (%) for 21st October 2007
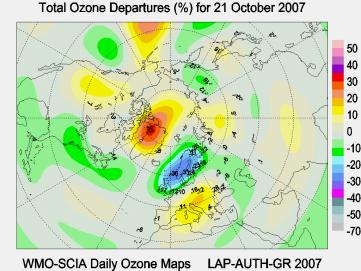
The origin of this event was a persistent deep anti-cyclonic anomaly over Scandinavia that lifted the tropopause causing divergence of ozone in the column and advection of ozone poor air from the South-West. Tropopause and stratospheric temperatures over Scandinavia were 8-10K below their climatological mean, but not sufficiently low to generate polar stratospheric clouds. It is therefore unlikely that there is a significant chemical contribution to this event. This is the season of annual mid-latitude ozone minimum. Therefore any dynamic mini-hole is likely to cause an extreme ozone low. The short-term daily ozone change in the order of 50 DU is typical for such an event, but when this happens during a seasonal low records can be broken.
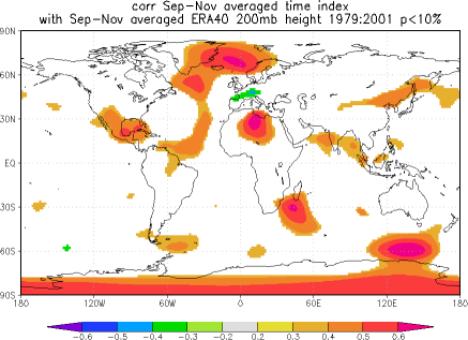
However, of some concern is that this event is consistent with a long-term decline of 3% per year since 1979 during the autumn season. It may be more instructive to search for a chemical signal in the seasonal ozone minimum rather than for example the maximum. This is largely because of a bigger signal to noise ratio where ozone variability and absolute levels are smaller in autumn, so there is a better chance of detecting a given absolute amount of ozone depletion. However, this season is not affected by chlorine activation (polar stratospheric clouds) and may therefore have been neglected by past research. There is no explanation as to the cause of the long-term trend. One may hypothesise that the seasonal minimum is a good indicator of global mean ozone levels. The chemical contribution is not clear at the moment. Figure B shows the ERA-40 trends of Autumn 200 hPa geopotential height - it seems that there is a significant increase near Lerwick. This would be consistent with a negative ozone trend. These trends occur irregularly for other months and locations, so it may just be a co-incidence of a tropospheric trend with the seasonal ozone minimum.
Figure B: ERA-40 trends of Autumn 200 hPa geopotential height
The event centred on the 21st of October was particularly severe with a daily averaged column reported of 189 DU. This was the lowest recorded ozone column for over 40 years at Lerwick and is similar to Antarctic Ozone hole levels. However, the corresponding satellite OMI overpass observation for that day was 220 DU. This discrepancy of 16% is too large to be explained by instrument noise and more likely due to differences in the data reduction polynomials. There is however no doubt that there was a mini hole over Lerwick at this time.
This event commenced as a relatively small mini-hole near Iceland on the 17th October. This is a frequent zone of the genesis of mini-holes that arrive over Lerwick. This anomaly was then advected towards Lerwick and became stationary and intensified over Lerwick and Scandinavia until the 24th October. It did not cover much of the UK as can be seen by the map (Figure A) and this is confirmed by unremarkable ozone columns at Manchester and Reading.
Figure A: Total Ozone Departures (%) for 21st October 2007
The origin of this event was a persistent deep anti-cyclonic anomaly over Scandinavia that lifted the tropopause causing divergence of ozone in the column and advection of ozone poor air from the South-West. Tropopause and stratospheric temperatures over Scandinavia were 8-10K below their climatological mean, but not sufficiently low to generate polar stratospheric clouds. It is therefore unlikely that there is a significant chemical contribution to this event. This is the season of annual mid-latitude ozone minimum. Therefore any dynamic mini-hole is likely to cause an extreme ozone low. The short-term daily ozone change in the order of 50 DU is typical for such an event, but when this happens during a seasonal low records can be broken.
However, of some concern is that this event is consistent with a long-term decline of 3% per year since 1979 during the autumn season. It may be more instructive to search for a chemical signal in the seasonal ozone minimum rather than for example the maximum. This is largely because of a bigger signal to noise ratio where ozone variability and absolute levels are smaller in autumn, so there is a better chance of detecting a given absolute amount of ozone depletion. However, this season is not affected by chlorine activation (polar stratospheric clouds) and may therefore have been neglected by past research. There is no explanation as to the cause of the long-term trend. One may hypothesise that the seasonal minimum is a good indicator of global mean ozone levels. The chemical contribution is not clear at the moment. Figure B shows the ERA-40 trends of Autumn 200 hPa geopotential height - it seems that there is a significant increase near Lerwick. This would be consistent with a negative ozone trend. These trends occur irregularly for other months and locations, so it may just be a co-incidence of a tropospheric trend with the seasonal ozone minimum.
Figure B: ERA-40 trends of Autumn 200 hPa geopotential height