September 2000
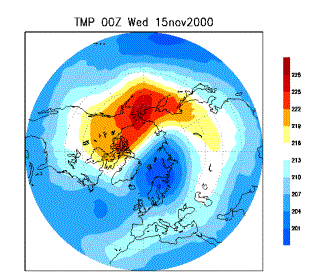
Using stratospheric temperatures at 50 mb as a diagnostic for dynamic disturbances, these low ozone values could all be accounted for by intrusion of low-latitude ozone-poor air rather than as chemical depletion. It is however difficult to quantify the extent of chemical depletion without a comprehensive suite of chemical measurements. To first order, the dynamic variations appear to dominate the column ozone variations. The event on the 15th of November was the lowest ozone value reported in the last 20 years (194 DU). The 50 mb temperature plot for the day shows a classic wave number. Cold temperature will give rise to low ozone as air is either ascending and/or transported from low latitude. However, it must be borne in mind that there is a seasonal minimum at this time and that a natural fluctuation about a low mean can be expected to give new absolute records. Furthermore, there is a disagreement of the severity of these two events with TOMS reporting nearly 10% higher values (The TOMS satellite recorded a value of approximately 207 DU over the region on the 15th November, as shown in the figure right).

TOMS Map of the Low Ozone Event which Occurred on 15th November 2000
In addition, there were two other low ozone events (on 20th December 2002 and 13th January 2003) which were not observed at either Lerwick or Camborne because the event either occurred during the period when the ozone measurements are out of range at the Lerwick station or the measurement was just within the site's own climatological two standard deviation anomaly band ( e.g. Camborne on 13th January 2003).
Using stratospheric temperatures at 50 mb as a diagnostic for dynamic disturbances, these low ozone values could all be accounted for by intrusion of low-latitude ozone-poor air rather than as chemical depletion. It is however difficult to quantify the extent of chemical depletion without a comprehensive suite of chemical measurements. To first order, the dynamic variations appear to dominate the column ozone variations. The event on the 15th of November was the lowest ozone value reported in the last 20 years (194 DU). The 50 mb temperature plot for the day shows a classic wave number. Cold temperature will give rise to low ozone as air is either ascending and/or transported from low latitude. However, it must be borne in mind that there is a seasonal minimum at this time and that a natural fluctuation about a low mean can be expected to give new absolute records. Furthermore, there is a disagreement of the severity of these two events with TOMS reporting nearly 10% higher values (The TOMS satellite recorded a value of approximately 207 DU over the region on the 15th November, as shown in the figure right).

TOMS Map of the Low Ozone Event which Occurred on 15th November 2000
In addition, there were two other low ozone events (on 20th December 2002 and 13th January 2003) which were not observed at either Lerwick or Camborne because the event either occurred during the period when the ozone measurements are out of range at the Lerwick station or the measurement was just within the site's own climatological two standard deviation anomaly band ( e.g. Camborne on 13th January 2003).
