
Automatic Urban and Rural Network (AURN)
Introduction
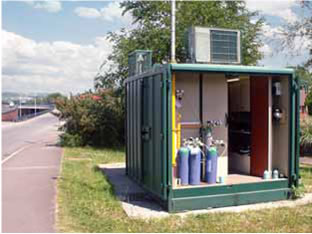
The AURN is the UK's largest automatic monitoring network and is the main network used for compliance reporting against the Ambient Air Quality Directives. It includes automatic air quality monitoring stations measuring oxides of nitrogen (NOx), sulphur dioxide (SO2), ozone (O3), carbon monoxide (CO) and particles (PM10, PM2.5). These sites provide high resolution hourly information which is communicated rapidly to the public, using a wide range of electronic, media and web platforms.
What is measured?
The table of parameters lists everything measured since the AURN network started, and is not necessarily what the network is measuring at this current time.
| Parameters Measured | Monitoring sites and data |
|---|---|
|
Ozone Nitric oxide Nitrogen dioxide Nitrogen oxides as nitrogen dioxide Sulphur dioxide Carbon monoxide PM10 particulate matter (Hourly measured) Non-volatile PM10 (Hourly measured) Volatile PM10 (Hourly measured) PM2.5 particulate matter (Hourly measured) Non-volatile PM2.5 (Hourly measured) Volatile PM2.5 (Hourly measured) PM10 particulate matter (Daily measured) PM2.5 particulate matter (Daily measured) Daily measured PM10 (uncorrected) Daily measured PM2.5 (uncorrected) Modelled Wind Direction Modelled Wind Speed Modelled Temperature |
Current sites: 205 Total sites: 317 Data availability: 01/07/1972 to 11/03/2026 |
What is the purpose of the network?
The major objectives of the network are as follows:
- Checking if statutory air quality standards and targets are met;
- Informing the public about air quality;
- Providing information for local air quality review and assessments within the UK Air Quality Strategy;
- Identifying long-term trends in air pollution concentrations; and
- Assessing the effectiveness of policies to control pollution.
The data from the AURN are used for:
- Compliance reporting under the Air Quality Standards Regulations 2010
- Comparison with air quality objectives as laid out in the Air Quality Strategy
- Providing the public with information through air quality bulletins
- Forecasting future air quality levels
- Policy development for human health and ecosystem protection
- The European Monitoring & Evaluation Programme (EMEP)
- The UK Local Air Quality Management regime under Part IV of the Environment Act 1995
- National Indicators on environmental quality
How is the network run?
A number of organisations are involved in the day-to-day running of the network. Currently, the role of Central Management and Co-ordination Unit (CMCU) for the whole AURN is contracted to Bureau Veritas, whilst Quality Assurance and Quality Control (QA/QC) activities are contracted to the National Physical Laboratory for London (the ALN), and Ricardo Energy & Environment for the rest of the AURN. The responsibility for operating individual monitoring sites is assigned to local organisations, such as local authority Environmental Health Officers with relevant experience in the field. Calibration gases for the network are supplied by BOC Limited and are provided with a UKAS certificate of calibration by Ricardo Energy & Environment.
Annual reports can be viewed in the Library section.
Monitoring Methods
The techniques used for monitoring within the AURN are summarised (on the monitoring methods page of this website).
The interactive map page provides an interactive view of this network with links to site information and latest data.
Data Verification and Ratification
The following PDF is available: The Data Verification and Ratification Process (PDF) which contains more information about the data verification and ratification process.
Current and Closed AURN monitoring sites
To view the current monitoring sites within the AURN, view the current levels page which also shows the parameters measured.
Information about closed AURN sites is also available for reference purposes.
Select an AURN monitoring site from the dropdown below to view the associated site information.
View data for sites in this network
You can view the latest data from this network on the Latest pollution summary page.
Data can be downloaded from the Data Selector section of this website.