
About Air Pollution
Air pollution can cause both short term and long term effects on health and many people are concerned about pollution in the air that they breathe. These people may include:
- People with heart or lung conditions, or other breathing problems, whose health may be affected by air pollution.
- Parents, carers and healthcare professionals who look after someone whose health is sensitive to pollution.
- People who want to know more about air pollution, its causes, and what they can do to help reduce it.
- The scientific community and students, who may need data on air pollution levels, either now or in the past, throughout the UK.
Free, detailed, clear and easy to use information on air pollution in the UK is available for all these purposes.
A Guide to UK Air Pollution Information Resources (HTML page - opens in a new window) is available for download. This includes information about:
- The air quality information that is available to the public and where to find it.
- The Daily Air Quality Index used in pollution forecasts and summaries.
- Other sources of information which may be useful.
Using this website
For monitoring and reporting air pollution the UK has been divided into non-agglomeration zones and agglomeration zones. There are fifteen non-agglomeration zones defined which match:
- the boundaries of England's Government Offices for the Regions; and
- the boundaries agreed by the Scottish Government, Welsh Government and Department of the Environment in Northern Ireland.
The map below shows the 16 regions and 16 urban areas which are used for reporting latest real-time monitoring data. These are a subset of the UK agglomeration and non-agglomeration zones (not all the smaller UK agglomeration zones have real-time monitoring). A full detailed report is available on the designation of UK non-agglomeration and agglomeration zones (PDF 8.1 MB).
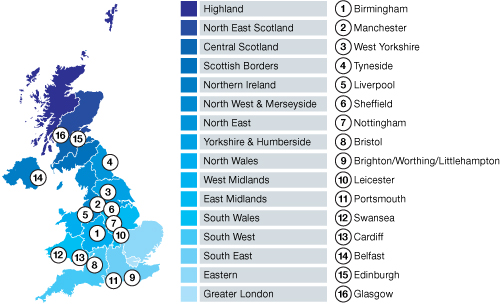
Measurement Data
From the map on the latest summary page you can select one of the sixteen regions to show the latest air pollution measurements and forecasts for that area, and then find out about the monitoring stations where the measurements are made.
Air pollution is described on a scale of 1-10 where 1 corresponds to 'Low' pollution and 10 corresponds to 'Very High' pollution using the Daily Air Quality Index (DAQI). The DAQI also provides health advice and recommended actions for short term exposure to air pollution.
The latest air pollution information reported here is based on results from over 120 automatic monitoring systems which take readings every hour. In addition to these, there are over 150 non-automatic monitors which sample air pollution levels on a daily, weekly or monthly basis.
You can also search to find where the automatic monitoring of air pollution is undertaken near you.
Air Pollution Forecasts
Air Quality Forecasts are issued on a national scale but can also be searched by postcode or favourite location. Forecasts are a prediction of the Daily Air Quality Index at each of 5800 locations over the UK.
See the Forecasting section for more information about the latest air pollution forecast and how it is produced.