

5.3 SO2 Emission Estimates
Since 1970 there has been a substantial overall reduction of around 68% in SO2 emissions (Figure 5.6). The emission profile exhibits a steady decline between 1970 and 1996 with the exception of small peaks in 1973 and 1979 corresponding to the harsh winters in those years and a short period at the end of the 1980s when the profile was relatively flat.
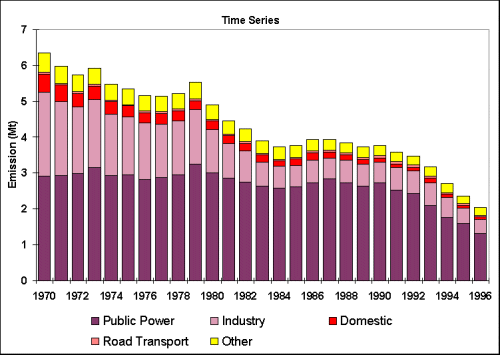
Table 5.3 shows emissions broken down by fuel categories. The two main contributors are solid fuel and petroleum products. Emissions from solid fuel use have declined by 63% over the period and those from petroleum by 78%. The most important factors in the fall in emissions from petroleum use are the decline in fuel oil use and the reduction in the sulphur content of gas oil and DERV. The reduction in the sulphur content of gas oil is particularly significant in sectors such as domestic heating, commercial heating and off-road sources where gas oil is used extensively. Although the sulphur content of DERV has reduced its consumption has increased so that overall there has been little change since 1970.
Table 5.3 UK Emissions of Sulphur Dioxide by UNECE1 Source Category and Fuel (kt)
| 1970 | 1975 | 1980 | 1985 | 1990 | 1993 | 1994 | 1995 | 1996 | 1996% | |
| By UNECE Category | ||||||||||
| Comb. in Energy Prod & Transf. | ||||||||||
| Public Power | 2913 | 2941 | 3007 | 2627 | 2723 | 2089 | 1764 | 1589 | 1318 | 65% |
| Petroleum Refining Plants | 213 | 218 | 237 | 96 | 108 | 155 | 138 | 124 | 122 | 6% |
| Other Comb. & Trans. | 306 | 120 | 73 | 55 | 44 | 13 | 11 | 10 | 9 | 0% |
| Comb. in Comm/Inst/Resid/Agri | ||||||||||
| Domestic | 522 | 301 | 226 | 202 | 108 | 112 | 91 | 65 | 69 | 3% |
| Other | 320 | 214 | 218 | 133 | 90 | 95 | 81 | 61 | 59 | 3% |
| Combustion in Industry | 1815 | 1285 | 903 | 416 | 442 | 476 | 392 | 304 | 260 | 13% |
| Production Processes | 117 | 118 | 117 | 122 | 118 | 108 | 109 | 95 | 99 | 5% |
| Extr./Distrib. of Fossil Fuels | 5 | 5 | 5 | 9 | 16 | 5 | 6 | 6 | 7 | 0% |
| Solvent Use | 0 | 0 | 0 | 0 | 0 | 0 | 0 | 0 | 0 | 0% |
| Road Transport | 44 | 48 | 42 | 44 | 63 | 59 | 63 | 51 | 37 | 2% |
| Other Transp & Mach. | ||||||||||
| Off-Road | 33 | 32 | 18 | 9 | 7 | 7 | 6 | 5 | 5 | 0% |
| Shipping | 35 | 28 | 25 | 26 | 27 | 30 | 29 | 29 | 30 | 1% |
| Other | 24 | 23 | 18 | 15 | 13 | 12 | 12 | 11 | 11 | 1% |
| Waste Treatment & Disp. | 4 | 4 | 5 | 5 | 5 | 4 | 4 | 2 | 1 | 0% |
| Agricult/Forest/Land Use Change | 0 | 0 | 0 | 0 | 0 | 0 | 0 | 0 | 0 | 0% |
| Nature | 0 | 0 | 0 | 0 | 0 | 0 | 0 | 0 | 0 | 0% |
| By Fuel | ||||||||||
| Solid | 3701 | 2806 | 3164 | 2648 | 2791 | 2182 | 1849 | 1643 | 1372 | 68% |
| Petroleum | 2371 | 2288 | 1535 | 908 | 769 | 844 | 720 | 588 | 530 | 26% |
| Gas | 202 | 164 | 101 | 91 | 85 | 36 | 30 | 22 | 24 | 1% |
| Non-fuel | 76 | 79 | 94 | 112 | 119 | 105 | 107 | 99 | 102 | 5% |
| Total | 6350 | 5337 | 4894 | 3759 | 3764 | 3166 | 2705 | 2351 | 2028 | 100% |

The largest contribution to SO2 emissions is from power stations which accounts for 65% of the total in 1996. Since 1970 there has been a gradual decline in power station emissions of around 55%. This reflects the changes in fuel mix and the types of power plant which have taken place during the period. Up to 1990 the reduction was due to a gradual increase in the use of nuclear plant and improvements in efficiency (See Section 2.2.2). Since 1990, this decline has accelerated because of the increase in the proportion of electricity generated in nuclear plant and the use of Combined Cycle Gas Turbine (CCGT) stations and other gas fired plant. CCGTs are more efficient than conventional coal and oil stations and have negligible SO2 emissions. It is expected that these reductions will continue in the near future as more CCGT stations are built. Most recently the flue gas desulphurisation plants, constructed at Drax and Ratcliffe power stations have had a significant effect. It is estimated that around 0.39 Mt of SO2 were removed in 1996 compared with a total emission from coal fired power stations of 1.153 Mt.
5.3.2 Industry
Emissions of SO2 from industry result from the combustion of coal and oil, some refinery processes and the production of sulphuric acid. Between 1970 and 1996 industrial emissions from combustion sources have fallen by 86% though most of the fall took place between 1970-1985 reflecting the decline in the energy intensive iron and steel industry and other heavy industries. There has been also been a decline in the use of coal and oil in favour of natural gas.
5.3.3 Transport
Transport emissions account for just 2% of the total SO2 emissions. Between 1970 and the early 1990s, road transport emissions grew with the increase in road vehicles, however more recently emissions have declined with the reduction in the sulphur content of DERV. Similarly the reduction in sulphur content of gas oil is reflected in the emissions from off-road vehicles.
5.3.4 Other
Emissions from the remaining categories are low compared with those discussed above. Emissions from domestic use and other commercial/institutional have declined substantially during the period 1970-1996, reflecting the major changes in fuel mix from oil and coal to gas. The only category that shows any marked increase during the period is extraction and distribution which includes leakage from the gas transmission system and emissions from flaring, natural gas use, venting and well testing from the offshore oil and gas industry. The decrease in emissions from waste reflects the closure of a number of old incinerators due to the introduction of new emission standards.