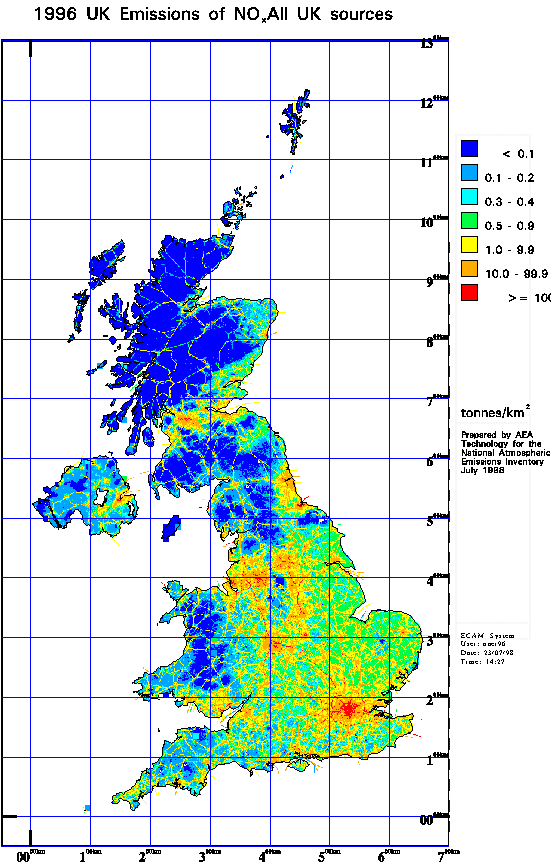
Figure 5.2 Mapped NOx Emissions


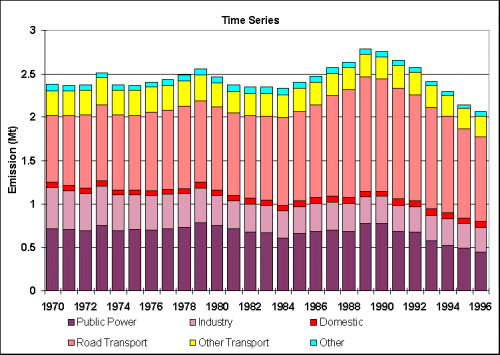
Since 1970 there has been a small reduction in emissions of around 13%, however the variation in emissions has not been smooth (Figure 5.1). Up to 1984 the NOx emission profile was relatively flat with small peaks in 1973 and 1979, as seen previously for CO2, which were due largely to the cold winters in those years. However, from 1984, emissions rose markedly as a result of the growth in road traffic reaching a peak in 1989 (Table 5.2). Since 1989, total emissions have declined by 26% as a result of a 42% reduction from power stations and 27% decrease from road transport.
| 1970 | 1975 | 1980 | 1985 | 1990 | 1993 | 1994 | 1995 | 1996 | 1996% | |
| By UNECE Category | ||||||||||
| Comb. in Energy Prod & Transf. | ||||||||||
| Public Power | 714 | 702 | 747 | 659 | 781 | 577 | 524 | 494 | 449 | 22% |
| Petroleum Refining Plants | 40 | 40 | 45 | 38 | 40 | 45 | 45 | 47 | 47 | 2% |
| Other Comb. & Trans. | 62 | 43 | 45 | 67 | 64 | 67 | 78 | 54 | 60 | 3% |
| Comb. in Comm/Inst/Resid/Agri | ||||||||||
| Domestic | 61 | 58 | 64 | 68 | 64 | 72 | 68 | 66 | 75 | 4% |
| Other | 57 | 42 | 46 | 44 | 37 | 38 | 38 | 38 | 39 | 2% |
| Combustion in Industry | 357 | 299 | 244 | 188 | 188 | 174 | 177 | 171 | 169 | 8% |
| Production Processes | 17 | 16 | 15 | 17 | 13 | 9 | 8 | 5 | 5 | 0% |
| Extr./Distrib. of Fossil Fuels | 0 | 0 | 0 | 1 | 1 | 0 | 1 | 1 | 1 | 0% |
| Solvent Use | 0 | 0 | 0 | 0 | 0 | 0 | 0 | 0 | 0 | 0% |
| Road Transport | ||||||||||
| DERV | 364 | 385 | 427 | 445 | 536 | 494 | 484 | 448 | 423 | 21% |
| Petrol | 401 | 477 | 532 | 583 | 747 | 670 | 625 | 582 | 543 | 26% |
| Other Transp & Mach. | ||||||||||
| Off-Road | 124 | 120 | 105 | 98 | 87 | 88 | 86 | 81 | 86 | 4% |
| Military | 48 | 48 | 48 | 49 | 54 | 44 | 40 | 37 | 35 | 2% |
| Railways | 35 | 30 | 28 | 25 | 21 | 21 | 21 | 21 | 20 | 1% |
| Shipping | 76 | 84 | 81 | 81 | 88 | 88 | 81 | 78 | 85 | 4% |
| Civil Aircraft | 5 | 8 | 10 | 11 | 12 | 15 | 15 | 16 | 17 | 1% |
| Waste Treatment & Disp. | 5 | 5 | 11 | 9 | 8 | 7 | 7 | 8 | 8 | 0% |
| Agricult/Forest/Land Use Change | 7 | 7 | 12 | 14 | 9 | 0 | 0 | 0 | 0 | 0% |
| Nature | 0 | 0 | 0 | 0 | 0 | 0 | 0 | 0 | 0 | 0% |
| By Fuel | ||||||||||
| Solid | 817 | 696 | 781 | 656 | 801 | 564 | 515 | 484 | 428 | 21% |
| Petroleum | 1425 | 1488 | 1467 | 1499 | 1707 | 1575 | 1501 | 1397 | 1339 | 65% |
| Gas | 105 | 154 | 174 | 203 | 204 | 240 | 251 | 234 | 259 | 13% |
| Non-fuel | 27 | 27 | 39 | 40 | 40 | 29 | 30 | 31 | 33 | 2% |
| Total | 2375 | 2365 | 2460 | 2398 | 2752 | 2409 | 2297 | 2145 | 2060 | 100% |


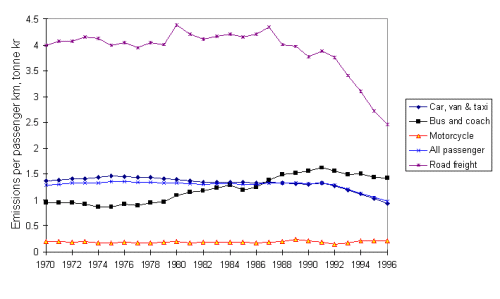
The major source of NOx emissions in the UK is the transport sector with road vehicles and off-road vehicles contributing 48 % and 4%, respectively, to the total emission. Road emissions rose steadily between 1970 and 1989 reflecting the overall growth in road traffic in the UK. During this period emissions from petrol vehicles, predominantly cars, rose by 87% compared to the 1970 level and emissions from diesel vehicles rose by 56%. Figure 5.3 clearly shows the growth in the vehicle fleet during this period. Since 1989 there has been a steady decline in emissions due to the introduction of catalytic converters on cars and stricter regulations on truck emissions.

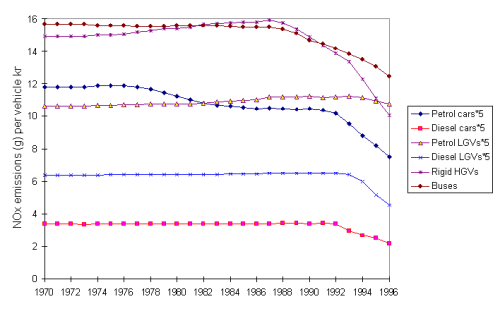
Figure 5.4 shows the average NOx emissions per vehicle kilometre for different vehicle types. Various emission regulations on new petrol cars which have come into effect in stages since 1976 have led to the gradual reduction in emission rates from petrol cars; the more rapid decline in emissions from 1992 is due to the penetration of cars fitted with three-way catalysts. Limits on emissions from diesel cars and LGVs did not first come into effect until 1993/94. Overall emissions per kilometre from HGVs showed a small rise from 1970-1987 due to the increasing usage of larger HGVs for freight movement. Limits on emissions from HGVs first came into effect in 1988 leading to a gradual reduction in emission rates as new HGVs penetrated the fleet, accelerated by tighter limits on emissions from new HGVs in 1993/94.


Other transport and machinery contribute a further 12% to total UK NOx emissions. Of these only those from civil aircraft have grown steadily over the period 1970 to 1996; however, they only comprise around 1% of the total emission.
5.2.2 Power Generation
Emissions from power stations have declined over the period 1970-1996 by around 37%. Emissions in the seventies were fairly flat with peaks in severe winters. Since 1979 emissions have declined with a minimum at the time of the miners strike. Prior to 1989 this decline was due to the increased use of nuclear power and an increase in the average efficiency of the thermal power stations. Since 1988 the electricity generators have adopted a programme of progressively fitting low NOx burners to their 500 MWe coal fired units. More recently the increased use of nuclear generation and the introduction of CCGT plant burning natural gas (See Section 2.2.2) have further reduced NOx emissions. The emissions from the low NOx turbines used are much lower than those of pulverised coal fired plant even when low NOx burners are fitted. Given that these trends continue, power station emissions are expected to fall further.
5.2.3 Industry
The emissions from industrial combustion have declined by 53% since 1970 and they currently contribute 8% to total UK emissions. This is due to the decline in coal use in favour of gas and electricity.