

4.3 Carbon monoxide Emission Estimates
Carbon monoxide arises from incomplete fuel-combustion and is of concern mainly because of its effect on human health. It leads to a decreased uptake of oxygen by the lungs and can lead to a range of symptoms as the concentration increases.
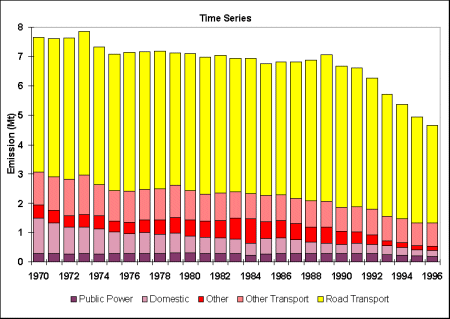
The UK emissions of carbon monoxide are shown in Figure 4.7 and Table 4.8 disaggregated by source and fuel. Over the period 1970-1996 emissions decreased by 39% reflecting significant reduction in emissions from road transport, domestic and agricultural sectors.
The spatial disaggregation of CO emissions is shown in Figure 4.8. The observed pattern of emissions is clearly dominated by road transport emissions. A large proportion of road transport emissions are from vehicles travelling at slow speeds on urban or minor roads, hence the map shows high emissions in urban conurbations.

The most important source is road transport and in particular petrol driven vehicles. Emissions from road transport were fairly constant between 1970 and 1990 but in recent years have declined steadily. This is due primarily to the increased use of catalytic converters and to a lesser extent to fuel switching from petrol cars to diesel cars. The next largest source is emissions from off-road sources, in particular petrol engined machinery. This includes portable generators, fork lift trucks, lawnmowers and cement mixers. The estimation of emissions from such machinery is very uncertain since it is based on estimates of equipment population and annual usage time.
| 1970 | 1975 | 1980 | 1985 | 1990 | 1993 | 1994 | 1995 | 1996 | 1996% | |
| By UNECE Category | ||||||||||
| Comb. in Energy Prod & Transf. | 325 | 304 | 333 | 292 | 315 | 267 | 240 | 230 | 207 | 4% |
| Comb. in Comm/Inst/Resid/Agri | ||||||||||
| Domestic | 1203 | 732 | 574 | 531 | 310 | 320 | 273 | 210 | 219 | 5% |
| Other | 41 | 24 | 23 | 22 | 19 | 17 | 16 | 15 | 16 | 0% |
| Combustion in Industry | 114 | 62 | 46 | 42 | 44 | 43 | 39 | 37 | 34 | 1% |
| Production Processes | 38 | 54 | 50 | 47 | 51 | 44 | 44 | 45 | 45 | 1% |
| Extr./Distrib. of Fossil Fuels | 2 | 2 | 2 | 4 | 7 | 2 | 3 | 3 | 3 | 0% |
| Solvent Use | 0 | 0 | 0 | 0 | 0 | 0 | 0 | 0 | 0 | 0% |
| Road Transport | 4589 | 4644 | 4666 | 4485 | 4822 | 4164 | 3893 | 3599 | 3299 | 71% |
| Other Transp & Mach. | ||||||||||
| Off-Road | 1093 | 1002 | 949 | 860 | 780 | 801 | 781 | 736 | 756 | 16% |
| Other | 41 | 42 | 42 | 41 | 42 | 42 | 41 | 41 | 41 | 1% |
| Waste Treatment & Disp. | 2 | 3 | 43 | 28 | 29 | 26 | 33 | 24 | 25 | 1% |
| Agricult/Forest/Land Use Change | 204 | 210 | 365 | 416 | 266 | 4 | 0 | 0 | 0 | 0% |
| Nature | 0 | 0 | 0 | 0 | 0 | 0 | 0 | 0 | 0 | 0% |
| By Fuel | ||||||||||
| Solid | 1557 | 997 | 869 | 771 | 576 | 493 | 419 | 334 | 321 | 7% |
| Petroleum | 5774 | 5737 | 5688 | 5421 | 5675 | 5064 | 4762 | 4425 | 4135 | 89% |
| Gas | 26 | 26 | 25 | 30 | 30 | 43 | 47 | 54 | 60 | 1% |
| Non-fuel | 295 | 319 | 511 | 546 | 406 | 130 | 134 | 126 | 129 | 3% |
| Total | 7652 | 7080 | 7093 | 6768 | 6687 | 5730 | 5362 | 4940 | 4645 | 100% |
Other emission sources of CO are small compared with transport and off-road sources. Emissions from the domestic sector have decreased by 82% since 1970 due to the decline in the use of solid fuels in favour of gas and electricity. The sudden decline in emissions from the agricultural sector reflects the banning of stubble burning in 1993 in England and Wales.
Power stations account for 4% of UK emissions; data have been recently revised to take account of lower emissions from low NOx burners and higher emission data from combined cycle gas turbines in line with the data available from the CRI (Environment Agency, 1997).
4.3.3 Accuracy of CO estimates
CO emissions depend on the technology employed and the specific combustion conditions. The emission factors used in the inventory have been derived from relatively few measurements of emissions from different types of boiler, hence they are less accurate than CO2 and SO2 emissions. Likewise CO emissions from road transport are subject to the same uncertainties surrounding NOx emissions. It is estimated that CO emissions are accurate to +/- 40%.