Appendix 1
The Methodology of the National Atmospheric Emissions Inventory
2.8 Road Transport
Emissions from road transport are calculated either from a combination of total fuel consumption data and fuel properties or from a combination of performance related emission factors and road traffic data. There have been several changes to the methodology and input data used for the 1996 inventory:
1) The most significant change has been to the hot exhaust emission factors used for all vehicle and pollutant types. These have been revised using new data from TRL (Hickman, 1998) and CORINAIR/COPERT II (European Environment Agency, 1997).
2) Fuel consumption data for each vehicle type have been revised with figures from COPERT
3) More detailed information on the composition of the UK vehicle parc has been used based on Vehicle Licensing Statistics from DETR, particularly for HGVs
4) Traffic data for Northern Ireland has been used for the first time, where previously it had been necessary to use fuel sales data in Northern Ireland as a surrogate statistic for traffic activity.
2.8.1 Fuel-based emissions
Emissions of carbon dioxide, sulphur dioxide and black smoke from road tranport are calculated from the consumption of petrol and diesel fuels and the properties of the fuels consumed. Data on petrol and diesel fuels consumed by road transport in the UK are taken from the Digest of UK Energy Statistics published by the DTI(1997), but were corrected for consumption by off-road vehicles.
In 1996, 22.41 Mtonnes of petrol and 14.37 Mtonnes of diesel fuel were consumed in the UK. It was estimated that of this around 1.8% of petrol and 0.1% of diesel fuel was consumed by off-road vehicles, leaving 22.01 Mtonnes of petrol and 14.35 Mtonnes of diesel consumed by road vehicles in 1996. Around 68% of the petrol sold in the UK was unleaded.
Emissions of CO2, expressed as kg carbon per tonne of fuel, are based on the H/C ratio of the fuel; emissions of SO2 are based on the sulphur content of the fuel. Values of the fuel-based emission factors for CO2, SO2 and black smoke from consumption of petrol and diesel fuels are shown in Table A15. Values for SO2 vary annually as the sulphur-content of fuels change and are shown in Table A15 for 1996 based on data from Institute of Petroleum (1997).
Table A15 Fuel-Based Emission Factors for Road Transport in kg/tonne fuel
| |
Ca |
SO2b |
Black smokec |
| Petrol |
855 |
0.518 |
0.645 |
| Diesel |
857 |
1.8 |
12.7 |
a Emission factor in kg carbon/tonne, based on UKPIA (1989)
b 1996 emission factor calculated from Institute of Petroleum (1997) figures on the weighted average sulphur-content of fuels delivered in the UK in 1996
c Keddie et al (1978); Timmis et al. (1988). Note that for diesel vehicles, the effective emission factor was reduced relative to earlier values in line with reductions in particulate emissions from heavy duty vehicles in the UK fleet since 1992.
Emissions of CO2, SO2 and black smoke can be broken down by vehicle type based on estimated fuel consumption factors and traffic data in a manner similar to the traffic-based emissions described below for other pollutants. The 1996 NAEI used fuel consumption factors expressed as g fuel per kilometre for each vehicle type and average speed calculated from the emission functions and speed-coefficients provided by COPERT. The breakdown of fuel consumption by each vehicle type is normalised so that the total adds up to the DTI figures for total fuel consumption in the UK.
2.8.2 Traffic-based emissions
Emissions of the pollutants NMVOCs, NOx, CO, benzene, CH4 and N2O are calculated from measured emission factors expressed in grammes per kilometre and road traffic statistics from the Department of Environment, Transport and the Regions (DETR, 1997a). The emission factors are based on experimental measurements of emissions from in-service vehicles of different types driven under test cycles of different average speeds. The road traffic data used are vehicle kilometre estimates for the different vehicle types and different road classifications in the UK road network. These data have to be further broken down by composition of each vehicle fleet in terms of the fraction of diesel- and petrol-fuelled vehicles on the road and in terms of the fraction of vehicles on the road made to the different emission regulations which applied when the vehicle was first registered. These are related to the age profile of the vehicle parc.
Emissions from motor vehicles fall into three different types which are each calculated in a different manner. These are hot exhaust emissions, cold-start emissions and, for NMVOCs and benzene, evaporative emissions.
Exhaust emissions of particulate matter, PM10, from vehicles (i.e. excluding emissions from tyre and brake wear) are also calculated from emission factors and traffic data, but different procedures are used for estimating emissions from petrol cars and LGVs and diesel vehicles.
2.8.3 Hot exhaust emissions
Hot exhaust emissions are emissions from the vehicle exhaust when the engine has warmed up to its normal operating temperature. Emission factors depend on the type of vehicle, the type of fuel its engine runs on, the average speed it is travelling at and the emission regulations which applied when the vehicle was first registered as this defines the type of technology the vehicle is equipped with which effects emissions.
2.8.4 Vehicle and fuel type
Emissions are calculated from vehicles of the following types:
- Petrol cars
- Diesel cars
- Petrol Light Goods Vehicles (Gross Vehicle Weight (GVW)
ó 3.5 tonnes)
Diesel Light Goods Vehicles (Gross Vehicle Weight (GVW) ó 3.5 tonnes)
Rigid-axle Heavy Goods Vehicles (GVW > 3.5 tonnes)
Articulated Heavy Goods Vehicles (GVW > 3.5 tonnes)
Buses and coaches
Motorcycles
Total emission rates are calculated by multiplying emission factors in g/km with annual vehicle kilometre figures for each of these vehicle types.
2.8.5 Vehicle kilometres by road type
Hot exhaust emission factors are dependent on average vehicle speed and therefore the type of road the vehicle is travelling on. Average emission factors are calculated for average speeds on four specified types of roads and combined with the number of vehicle kilometres travelled by each type of vehicle on each of these road types:
- Urban
- Rural single carriageway
- Rural dual carriageway
- Motorway
DETR estimate annual vehicle kilometres by vehicle type on 11 different road classifications in Great Britain (DETR, 1997a). These estimates are based on traffic counts from the rotating census and core census surveys (DETR, 1997b). Detailed traffic data for Northern Ireland has not previously been available for the NAEI, so it has been necessary to use fuel sales statistics as an indicator of traffic activity. For the 1996 NAEI, detailed traffic data for Northern Ireland has been made available from a travel survey for the Department of the Environment for Northern Ireland (DoE, N. Ireland, 1996). These data have been combined with the DETR data for Great Britain to produce a time-series of total UK vehicle kilometres by vehicle and road type from 1970 to 1996.
These data have been grouped into the four road types mentioned above for combination with the associated hot exhaust emission factors.
2.8.6 Vehicle split by age and fuel type - fleet composition model
The vehicle kilometres data based on traffic surveys do not distinguish between the type of fuels the vehicles are being run on (petrol and diesel) nor on their age distribution. The latter determines the type of emission regulation that applied when the vehicle was first registered. These have successively entailed the introduction of tighter emission control technologies, for example three-way catalysts, fuel injection systems and better engine management systems.
Table A16 shows the regulations which have come into force up to 1996 for each vehicle type. The year 1996 saw the introduction of the Euro II standard for cars and HGVs.
Table A16 Vehicle Types and Regulation Classes
| Vehicle Type |
Fuel |
Regulation |
Approximate date into service in UK |
| Cars |
Petrol |
Pre ECE-15.00 |
|
| |
|
ECE-15.00 |
1/1/1971 |
| |
|
ECE-15.01 |
1/7/1975 |
| |
|
ECE-15.02 |
1/7/1976 |
| |
|
ECE-15.03 |
1/7/1979 |
| |
|
ECE-15.04 |
1/7/1983 |
| |
|
EC 91/441/EEC (Stage I) |
1/7/1992 |
| |
|
EC Stage II |
1/1/1996 |
| |
Diesel |
Pre-EC Stage 1 |
|
| |
|
EC Stage 1 |
1/1/1993 |
| |
|
EC Stage II |
1/1/1996 |
| LGV |
Petrol |
Pre-EC Stage 1 |
|
| |
|
EC Stage 1 |
1/7/1994 |
| |
Diesel |
Pre-EC Stage 1 |
|
| |
|
EC Stage 1 |
1/7/1994 |
| HGV |
Diesel (All types) |
Old |
|
| |
|
Pre-EC Stage 1 |
1/10/1988 |
| |
|
EC Stage 1 |
1/10/1993 |
| |
|
EC Stage II |
1/10/1996 |
| Buses and coaches |
Diesel |
Old |
|
| |
|
Pre-EC Stage 1 |
1/10/1988 |
| |
|
EC Stage 1 |
1/10/1993 |
| |
|
EC Stage II |
1/10/1996 |
| Motorcycles |
Petrol |
Current < 50cc |
|
| |
|
Current >50cc, 2 stroke |
|
| |
|
Current >50cc, 4 stroke |
|
The average age profile and the fraction of petrol and diesel cars and LGVs in the traffic flow each year are based on the composition of the UK vehicle fleet using DETR Vehicle Licensing Statistics. The Transport Statistics Report "Vehicle Licensing Statistics: 1996" (DETR, 1997c) either gives historic trends in the composition of the UK fleet directly or provides sufficient information for this to be calculated from new vehicle registrations and average vehicle survival rates. The vehicle licensing data are combined with new data on the change in annual vehicle mileage with age to take account of the fact that newer vehicles on average travel a greater number of kilometres in a year than older vehicles.
The fraction of diesel cars and LGVs in the fleet was taken from data in "Vehicle Licensing Statistics: 1996" (DETR, 1997c). For 1996, the fraction of diesel cars in the fleet was 9.9% while the fraction of diesel LGVs was estimated to be 62%.
Year-of-first registration data for vehicles licensed in 1995 and 1996 (and for earlier years, where available) taken from DETR's Vehicle Licensing Statistics reflect the age distribution of the fleet in these years. Statistics are also available on the number of new registrations in each year up to 1996, reflecting the number of new vehicles entering into service in previous years. The two sets of data combined allow an average survival rate to be determined for each type of vehicle. For the 1996 NAEI, more detailed information was used on the composition of the HGV stock by age and size, allowing a more robust description of the HGV fleet than had previously been employed. The survival rates of LGVs and buses and coaches were also revised.
For the 1996 NAEI, new data from DETR on annual mileage with age has been adopted for all vehicle types. For cars and LGVs, data are from the National Travel Survey (DETR, 1998); data for HGVs of different weights are from the Continuous Survey of Road Goods Transport (DETR, 1996a).
The available figures suggest that in 1996, 26% of the petrol car stock was fitted with three-way catalysts, whereas because of the higher average mileage made by newer cars, 36% of the UK car kilometres are made by cars fitted with three-way catalysts.
In the case of petrol cars, it is assumed that the catalysts fail in 5% of cars fitted with them each year. It is also assumed that 95% of failed catalysts will be repaired each year, but only for cars more than three years in age when they first reach the age for MOT testing.
2.8.7 Hot emission factors
The emission factors for NOx, CO and NMVOCs (and PM10 for diesel vehicles) used for the 1996 NAEI have been substantially revised using new data from TRL and CORINAIR/COPERT II. Both these sources provide emission functions and coefficients relating emission factor (in g/km) to average speed for each vehicle type and Euro emission standard derived by fitting experimental measurements to some polynomial functional form. These functions were then used to calculate single emission factor values for each vehicle type and Euro emission standard at average speeds on the four specified types of roads.
Whenever possible, the emission factors were calculated from the equations provided by TRL (Hickman, 1998) from analysis of data gathered from measurements of on-road vehicles of different ages tested on rolling roads or engine test beds. The measurements were made by TRL on UK vehicles or were drawn from the Workbook of Emission Factors for Road Transport produced at UBA Berlin (Infras, 1995). Where data were unavailable from TRL for particular Euro standards, the data were taken from the equations recommended by COPERT II, "Computer Programme to Calculate Emissions from Road Transport" produced by the European Topic Centre on Air Emissions for the European Environment Agency (1997). For the same pollutant, vehicle type and emission standard, the TRL and COPERT II data gave broadly similar emission factors.
For the more recent Euro II standard (and Euro I for some vehicle types), there have not yet been any measurements of emissions from in-service vehicles. Therefore, emission factors were calculated using scaling factors relative to Euro I values taken from COPERT II or Gover et al. (1994).
For each type of vehicle, both TRL and COPERT II provide equations for different ranges of vehicle engine capacity or vehicle weight; emission factors calculated from these equations were therefore averaged, weighted according to the proportion of the different sizes in the UK fleet, to produce a single average emission factor for each vehicle type. These average emission factors are given in Tables A17 to A19 for each of the different vehicle types and emission regulations.
The older in-service vehicles surveyed that were manufactured to a particular emission standard would have covered a range of different ages. Therefore, an emission factor calculated for a particular emission standard (e.g. ECE 15.04) from the emission functions and coefficients from TRL and COPERT is effectively an average value for vehicles of different ages which inherently takes account of possible degradation in emissions with vehicle age. However, for the more recent emission standards (EC Stage I and Stage II), the vehicles would have been fairly new when the emissions were measured. Therefore, based on data from the European Auto-Oil study, the deterioration in emissions with age or mileage was taken into account for catalyst cars. It was assumed that emissions of CO and NOx increase by 60% over 80,000 km, while emissions of NMVOCs increase by 30% over the same mileage (DETR, 1996b). Based on the average annual mileage of cars, 80,000 km corresponds to a time period of 6.15 years.
Emission factors for benzene were taken from two sources. For non-catalyst cars (i.e. ECE 15.00 to 15.04) and pre-Stage I diesel cars, emission factors were taken from Eggleston and Irwin (1993); for other vehicle types and emission standards (including catalyst cars), the emission factors are based on those for NMVOCs and percentage by weight of NMVOC speciation figures from COPERT II. These give figures of 3.5% of NMVOCs as benzene from petrol vehicles with three-way catalysts and 2% of NMVOCs as benzene from all diesel exhausts. Emission factors for benzene for the four road types are shown in Table 20 in units of milligrammes/km.
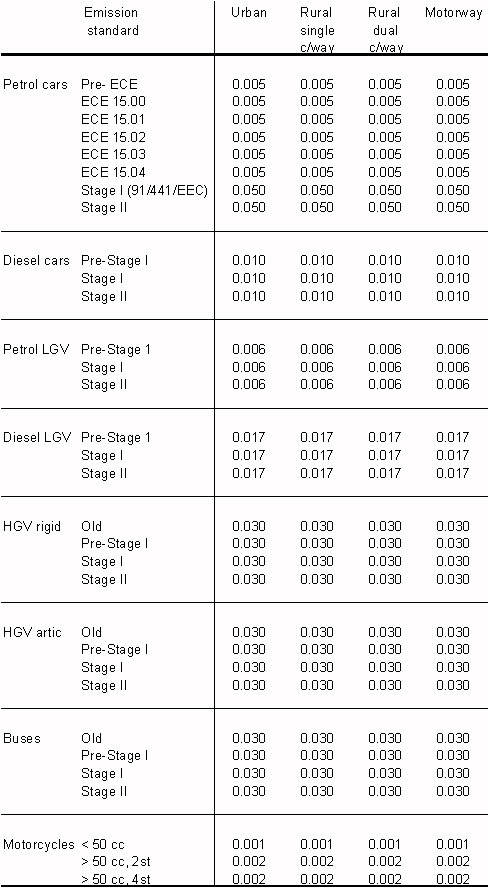
Hot emission factors for methane and nitrous oxide were taken from estimates for European vehicles and emission control technologies published in the 1995 IPCC Guidelines for National Greenhouse Gas Inventories. These are average values, not broken down by vehicle speed or road type. Their uncertainties can be expected to be quite large. They are shown in Tables A23 and A24.
Emission factors for motorcycles have not been changed from the values used for the 1995 NAEI for all pollutants.
2.8.8 Cold-Start Emissions
When a vehicle's engine is cold it emits at a higher rate than when it has warmed up to its designed operating temperature. This is particularly true for petrol engines and cars fitted with three-way catalysts. Emission factors have been derived for cars and LGVs from tests performed with the engine starting cold and warmed up. The difference between the two measurements can be regarded as an additional cold-start penalty paid on each trip a vehicle is started with the engine cold.
To calculate cold-start emissions of each pollutant, a cold-start emission factor is multiplied by the total number of trips made with the engine started cold. Cold-start emission factors in units of grammes per cold-started trip are given for NMVOCs, NOx, CO and benzene in Tables A17 to A19 for petrol and diesel cars and LGVs. These are unchanged from figures used for the 1995 NAEI. Cold-start emission factors are not available for HGVs and buses. They are also unavailable for the pollutants CH4 and N2O. It is assumed that two-thirds of all trips made are started with the engine cold. The total number of trips made in cars and LGVs is derived by dividing their total number of UK vehicle kilometres by an average trip length which has been estimated to be 8.4km in the UK (Andre et al., 1993).
Cold-start emissions for cars and LGVs calculated in this way are added to their hot exhaust emissions discussed previously.
2.8.9 Evaporative Emissions
Evaporative emissions of petrol fuel vapour from the tank and fuel delivery system in vehicles constitute a significant fraction of total NMVOC and benzene emissions from road transport. They are estimated for all petrol-engined vehicles by assuming that a certain fraction of the petrol consumed by them is released by evaporation. Hence, evaporative emissions are calculated from the fuel consumption data, used for estimating the fuel-based emissions of CO2 and SO2, and an evaporative emission factor in grammes per kg fuel consumed. For NMVOCs, an emission factor of 5.9 g/kg fuel is used for most vehicles, based on data from the USEPA, but a lower value of 1.0 g/kg fuel is applied to vehicles fitted with three-way catalysts, since these vehicles are also usually fitted with carbon-canisters for reducing evaporative emissions. Thus, from 1992, an average evaporative emission factor is used for the calculations, weighted by the fraction of petrol cars on the road with and without three-way catalysts. For 1996, the weighted average evaporative emission factor is 4.1 g/kg fuel. It is assumed that benzene represents 2% of evaporated NMVOC emissions.
The evaporative emissions calculated in this way are added to the hot exhaust and cold-start emissions of NMVOCs and benzene. The results suggest that in 1996, fuel evaporation contributed ~17% of all NMVOC emissions and ~7% of all benzene emissions from petrol vehicles.
2.8.10 PM10 Emissions
Exhaust emissions of PM10 from road transport are also calculated from emission factors and vehicle kilometre and fleet data, but slightly different procedures are used for petrol and diesel vehicles.
2.8.10.1 Petrol cars and LGVs
For petrol cars and LGVs, the emission factors used depend on whether the vehicles are run on leaded or unleaded fuel and whether fitted with a three-way catalyst, but the same values are applied to all types of road. The emission factors are shown in Table A21. Data from the Digest of UK Energy Statistics on the percentage of sales of leaded and unleaded petrol and the fraction of cars on the road with catalysts calculated in the fleet model are used to derive overall weighted average emission factors for cars and LGVs in each year. The fraction of petrol cars running on leaded, unleaded without catalyst and unleaded with catalyst estimated for 1996 in the UK is also shown in Table A21.
2.8.10.2 Diesel vehicles
For diesel vehicles, emission factors for PM10 have been revised using new data from TRL and COPERT II provided in the same format as for the pollutants NOx, CO and NMVOCs. These are shown in Table A22 for the different vehicle types, emission regulations and road types.
PM10 emissions have been found to be dependent on the sulphur content of diesel fuel. The emission factors for pre-Stage II diesel vehicles shown in Table A22 are based on measurements of emissions from vehicles running on standard diesel fuel of up to 2000 ppm sulphur content. In October 1996, legislation came into effect which limits the sulphur content of diesel fuel to 500 ppm. It has been estimated that this reduces primary PM10 emissions from pre-Stage II diesel cars and LGVs by 2.4% and from HGVs and buses by 13%. Therefore, the emission factors for these vehicles shown in Table A22 are reduced by these amounts from this date.
Research has suggested a deterioration in PM10 emissions from diesel cars and LGVs with age or mileage and this has now been taken into account in the same way as emissions of other pollutants from catalyst cars. Based on recommendations by DETR (1996b), it is assumed that PM10 emissions increase by 100% over 80,000 km for diesel cars and LGVs.
Cold-start emission factors are included for diesel cars and LGVs, but are unavailable for HGVs and buses. They are unchanged from the values used for the 1995 NAEI. Emissions from diesel vehicles are calculated from these emission factors and traffic and fleet data in the same way as for the other pollutants.
Emission factors for motorcycles are also included, although as for the other pollutants, the same values are applied to all the different road conditions in the absence of any other information on their emissions.
2.8.10.3 Brake and Tyre Wear
Factors from the US (USEPA, 1985) were used as the basis of these estimates. These were for cars and so, in the absence of better data, they were scaled up for larger vehicles by the number of wheels.
PM10 emissions from tyre wear are estimated to be 0.0012 g/km and brake wear 0.00795 g/km for motor cars.
Table A17 NMVOC Emission Factors for Road Transport (in g/km)
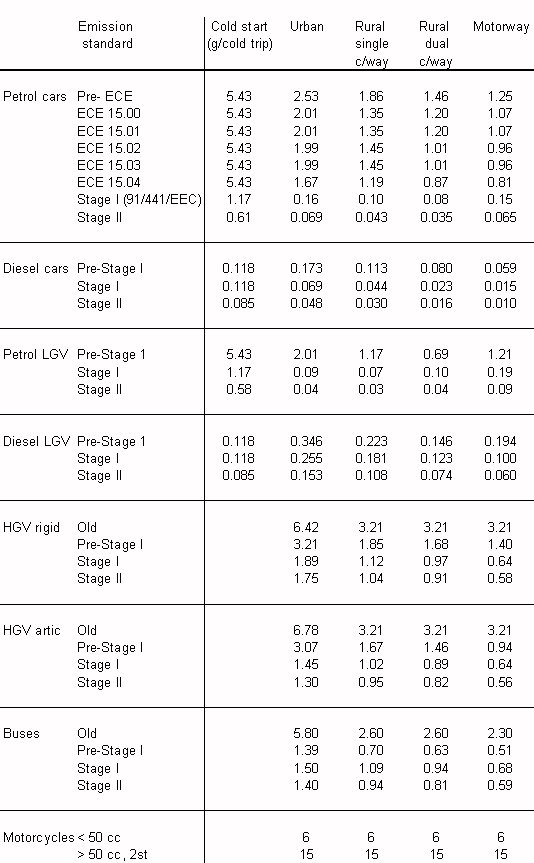
Table A18 NOx Emission Factors for Road Transport (in g/km)
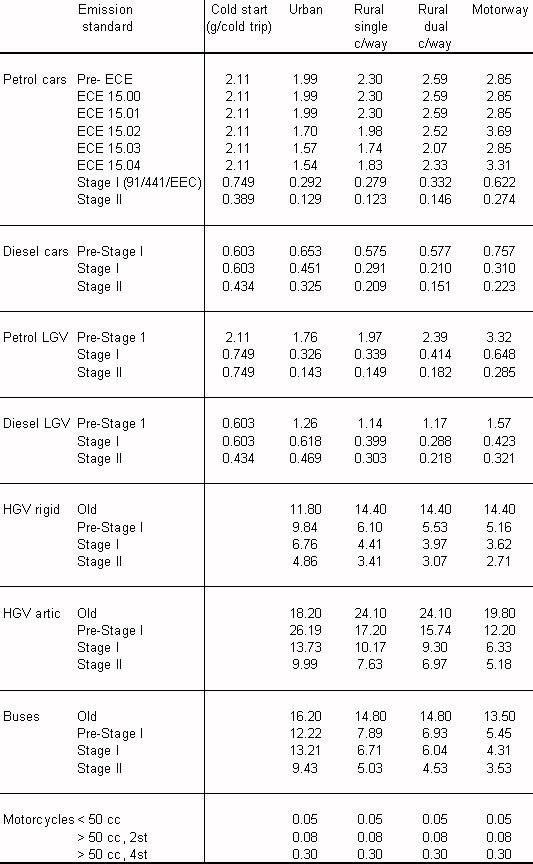
Table A19 CO Emission Factors for Road Transport (in g/km)
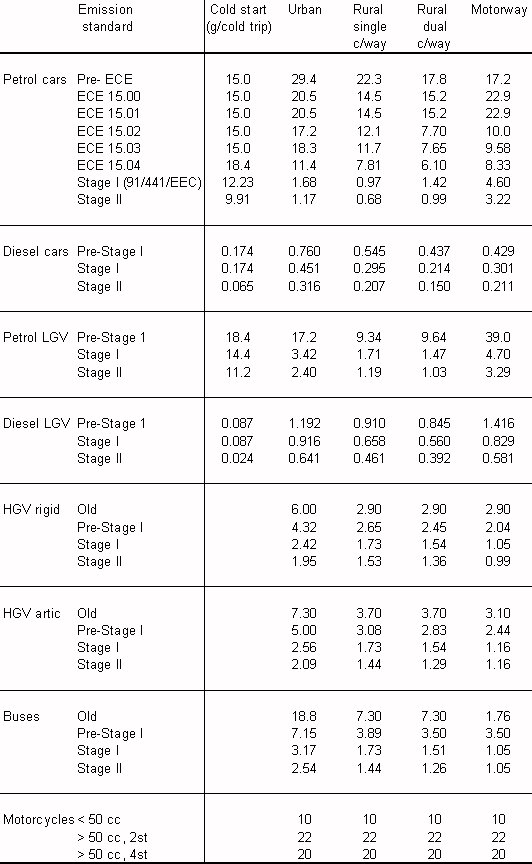
Table A20 Benzene Emission Factors for Petrol Vehicles (in mg/km)
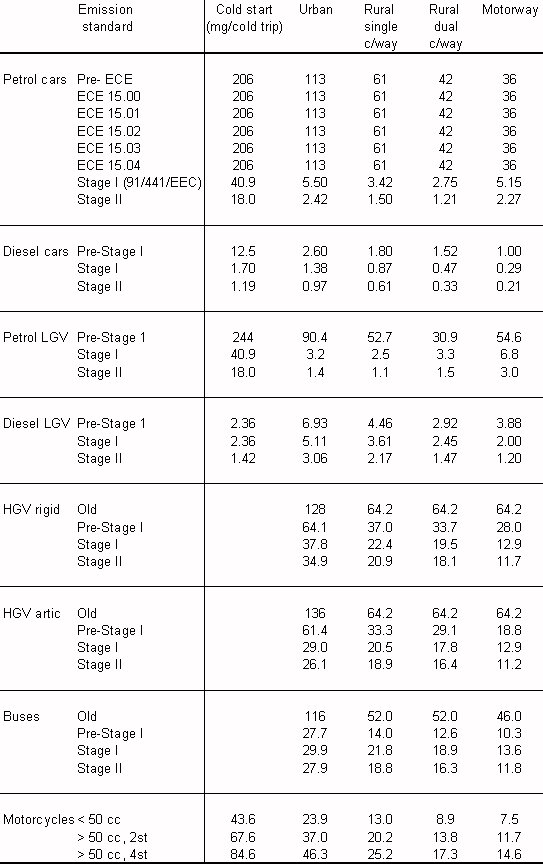
Table A21 PM10 Emission Factors for Petrol Vehicles (in g/km)
| |
Leaded |
Unleaded without TWC |
Unleaded with TWC |
| Cars |
0.06 |
0.02 |
0.01 |
| LGVs |
0.08 |
0.04 |
0.02 |
| % petrol car kms in 1996 |
32% |
32% |
36% |
Table A22 PM10 Emission Factors for Diesel Vehicles (in g/km) using conventional diesel fuel with up to 2000 ppm sulphur content prior to October 1996.
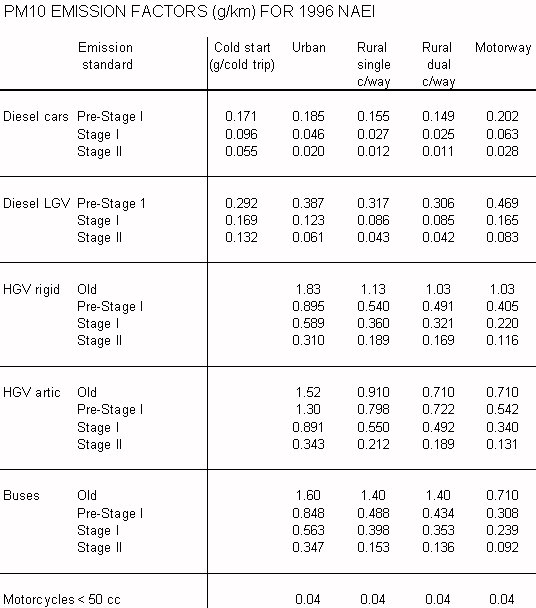
Table A23 Methane Emission Factors for Road Transport (in g/km)
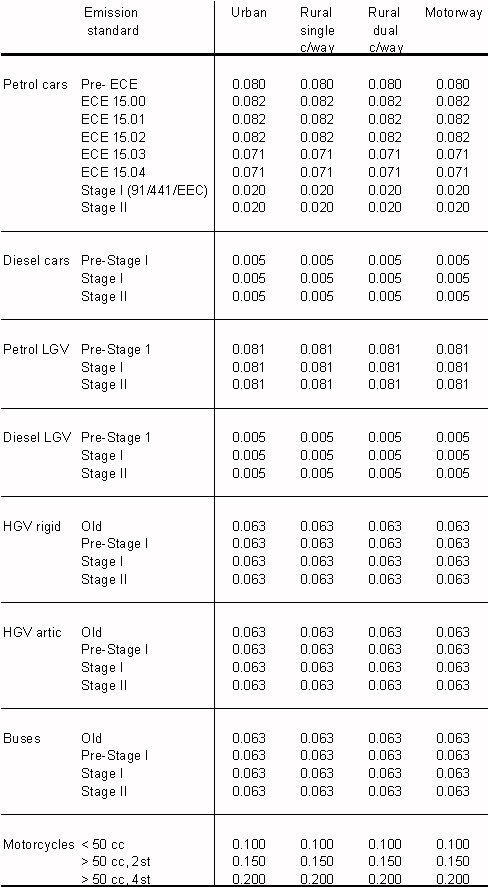
Table A24 Nitrous oxide Emission Factors for Road Transport (in g/km)