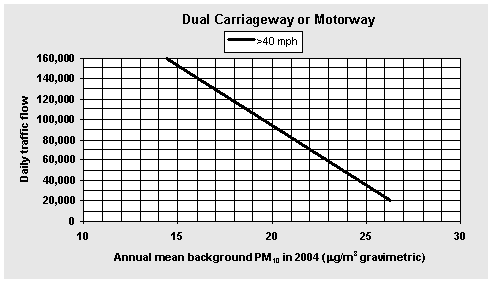
Figure 3: Relationship between daily mean traffic flow, annual mean background PM10 (2004) and the risk of exceeding the proposed objective. Dual carriageway, 12% HGV, receptor location 10 metres from kerbside; Motorway, 12% HGV, receptor location 15 metres from hard shoulder

Note:
The relationships between tailpipe emissions and TEOM and gravimetric measurements are uncertain, but there is the potential for loss of some of the volatile components. In addition, the DMRB model, which has been used to prepare the above nomograms, does not take account of the contribution of resuspended material to roadside PM10 concentrations. However, a conservative approach has been taken in deriving the relationship between the 90th percentile and the annual mean, and in the use of 1996 atypical meteorology to prepare the 2004 background PM10 maps. Therefore, a 1.3 adjustment factor has not been applied in the preparation of these nomograms.
Report prepared by Stanger Science and Environment
Site prepared by the National Environmental Technology Centre, part of AEA Technology, on behalf of the UK Department of the Environment, Transport and the Regions

