
Persistent organic
pollutants
Persistent organic pollutants (POPs) are found in
trace quantities in all areas of the environment. They are all toxic and
accumulate in humans and plants. POPs do not readily break down in the
environment with half-lives in soils in the order of years, although they may
be transformed both physically and chemically over long periods.
Over recent years there has been a growing interest in these pollutants
and in particular their potential chronic toxicity and impacts on human health.
This is reflected by the recent international agreement to reduce releases of
these chemicals under the UN/ECE Persistent Organic Pollutants Protocol
(detailed above) and their consideration for air quality standards by the
EPAQS. The detailed methodology for the compilation of these inventories
depends on the combination of emission factors gathered from a range of sources
and production statistics used elsewhere in the emission inventory or developed
for the specific sector concerned.
The UK NAEI does not include emission estimates for some POPs since many
have been banned in the UK for a number of years. Table 6.2 below indicates the
years in which particular POPs were banned or use severely restricted, and
whether the listed POPs are included in the NAEI.
Table 6.2 POPs Included/Not Included in the NAEI and Corresponding
Year of Ban1
|
Compound or Compound
Group |
Year of Ban |
Included in
NAEI |
Compound or Compound
Group |
Year of Ban |
Included in
NAEI |
|
Polycyclic aromatic hydrocarbons
(PAHs) |
- |
Y |
Pesticides (Cont) |
|
|
|
Dioxins and Furans
(PCDD/Fs) |
- |
Y |
Chlordane |
1992 |
N |
|
Polychlorinated biphenyls
(PCBs) |
- |
Y |
Dichlorodiphenyl-trichloroethane
(DDT) |
1984 |
N |
|
Hexabromobiphenyl |
NA3 |
N |
Chlordecone |
1977 |
N |
|
Pesticides |
|
|
Dieldrin |
1989 |
N |
|
g
-Hexachlorocyclohexane |
|
Y |
Endrin |
1984 |
N |
|
Pentachlorophenol1 |
19952 |
Y |
Heptachlor |
1981 |
N |
|
Hexachlorobenzene1 |
1975 |
Y |
Mirex |
NA3 |
N |
|
Aldrin |
1989 |
N |
Toxaphene |
NA3 |
N |
1Hexachlorobenzene and pentachlorophenol are also emitted from
other sources as well as being or having been active ingredients in
pesticides.
2 Use of pentachlorophenol is severely restricted rather
than banned absolutely.
3NA indicates that a year of ban is not applicable as the
compound was never approved for use in the UK as a pesticide.
Polycyclic aromatic hydrocarbons (PAHs)
Polycyclic aromatic hydrocarbons are a large group
of chemical compounds with a similar structure comprising two or more joined
aromatic carbon rings. Different PAHs vary both in their chemical
characteristics and in their environmental sources and they are found in
the environment both as gases and associated with particulate material. They
may be altered after absorption into the body into substances that are able to
damage the genetic material in cells and initiate the development of cancer,
although individual PAHs differ in their capacity to damage cells in this
way.
The speciated PAH inventory was first compiled for the 1996 emissions
inventory (see "Speciated PAH Inventory for the UK" Wenborn MJ 1999) and has
allowed a more detailed understanding of the PAH emissions in the UK.
There have been several pollutant classifications relating to PAHs.
Although there are a vast number of PAHs, the NAEI inventory focuses on
sixteen. These 16 PAHs have been designated by the United States Environmental
Protection Agency (USEPA) as compounds of interest under a suggested procedure
for reporting test measurement results (USEPA 1988). The estimated emissions
for individual compounds are given in Appendix 5. A subset of this includes six
of the PAHs identified by the International Agency for Research on Cancer
(IARC) as probable or possible human carcinogens (IARC 1987). In addition, the
Borneff 6 PAHs have been used in some EC emission inventory compilations. A
further subset of PAHs are those to be used as indicators for the purposes of
emissions inventories under the UN/ECE’s Persistent Organic Pollutants
Protocol. These classifications are given in the following table.
Table 6.3 The USEPA 16 PAH Primary Pollutants, and other PAH
Subsets.
| |
USEPA Priority pollutants
(16 PAH) |
IARC
Probable or possible Human
carcinogens
(6 PAH) |
Borneff
(6 PAH) |
UN/ECE
POPs Protocol
Indicators for purpose of emission
inventories |
|
Naphthalene
|
ü |
|
|
|
|
Acenapthene |
ü |
|
|
|
|
Acenapthylene |
ü |
|
|
|
|
Fluorene |
ü |
|
|
|
|
Anthracene |
ü |
|
|
|
|
Phenanthrene |
ü |
|
|
|
|
Fluoranthene |
ü |
|
ü |
|
|
Pyrene |
ü |
|
|
|
|
Benz[a]anthracene |
ü |
ü |
|
|
|
Chrysene |
ü |
|
|
|
|
Benzo[b]fluoranthene |
ü |
ü |
ü |
ü |
|
Benzo[k]fluoranthene |
ü |
ü |
ü |
ü |
|
Benzo[a]pyrene |
ü |
ü |
ü |
ü |
|
Dibenz[ah]anthracene |
ü |
ü |
|
|
|
Indeno[1,2,3-cd]pyrene |
ü |
ü |
ü |
ü |
|
Benzo[ghi]perylene |
ü |
|
ü |
|
The main environmental impact of PAHs relate to their health effects,
focusing on their carcinogenic properties. The most potent carcinogens have
been shown to be benzo[a]anthracene, benzo[a]pyrene and dibenz[ah]anthracene
(APARG 1996). The semi-volatile property of PAHs makes them highly mobile
throughout the environment via deposition and re-volatilisation between air,
soil and water bodies. It is possible that a proportion of PAHs released in the
UK are deposited in the oceans and/or subject to long range transport making
them a widespread environmental problem.
EPAQS published in 1999 a recommendation for an air quality standard
for PAHs based on the use of benzo[a]pyrene as an indicator of the overall
carcinogenicity of the PAHs present in the atmosphere. Emissions of
benzo[a]pyrene (BaP) and the total of the 16 PAH’s are summarised in Table
6.4. Aluminium production and anode baking (carried out for the aluminium
industry) is the largest source of PAH emissions in the UK, contributing 63 %
of the total emissions of the 16 PAHs in 1995. Emissions from anode baking then
fell considerably, comprising only 20% of the 16 PAH emission for 1999. Table
6.4 shows a reduction in emissions of benzo[a]pyrene from anode baking from 48%
of the national total in 1995 to 13% in 1999. As a consequence of investment in
abatement equipment following from the authorisation regime implementing the
Environmental Protection Act 1990, one of the anode baking plants has
dramatically reduced its emissions and the other will follow shortly.
Anode baking is currently the largest single source of the emissions
for eight of the individual PAHs studied. The largest sources of emission for
the remaining eight PAHs considered here are: road transport, domestic coal
combustion, domestic wood combustion and creosote production. For many of these
compounds, the anode baking source sector still accounts for a significant
percentage of the total emission.
Other major sources of all the PAHs are industrial and domestic coal
combustion and domestic wood combustion. Collectively, vehicles are a
significant source of many PAHs, with cars burning leaded petrol being the
largest subgroup. This reflects the higher emission factors resulting from not
having catalysts.
Wood treatment is a significant source of some of the lighter PAHs
such as acenapthene, fluorene and anthracene. Emissions from bitumen production
and use have not been estimated due to a lack of emission data. It is possible
that bitumen use is a significant source of benzo[a]pyrene and other PAHs.
Increased measurement of PAHs by both industry and regulators, particularly in
the aluminium sector, has allowed improvements in the precision of the emission
estimates.
Emissions of PAH and BaP from domestic combustion have increased since
1997. This reflects the increased consumption of coal in the domestic sector.
Similarly the emissions from "Other Industrial Combustion" increase from 1998
to 1999. This is also due to the higher consumption of coal in 1999.
The uncertainties associated with the emissions
estimates of PAHs are considered in Section 6.4.
Figure 6.1 Spatially Disaggregated UK Emissions of
Benzo[a]pyrene
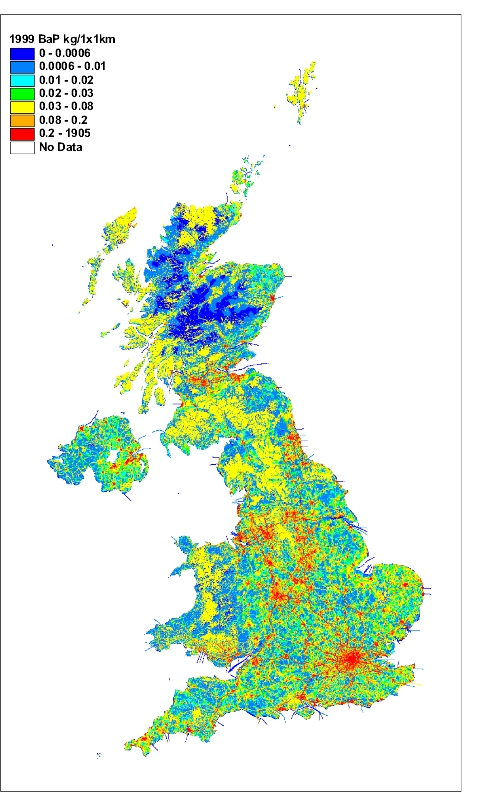
Table 6.4 UK Emissions of PAHs (Emissions of individual PAHs are given
in Appendix 5)
|
Emissions of 16 PAHs1
(tonnes) |
|
|
1970 |
1980 |
1990 |
1991 |
1992 |
1993 |
1994 |
1995 |
1996 |
1997 |
1998 |
1999 |
1999% |
|
BY UN/ECE
CATEGORY |
|
|
|
|
|
|
|
|
|
|
|
|
|
|
Comb. in Energy
Prod. |
|
|
|
|
|
|
|
|
|
|
|
|
|
|
Public Power |
|
|
5 |
5 |
5 |
4 |
3 |
3 |
3 |
2 |
2 |
2 |
0% |
|
Public Power (Waste
Incin) |
|
|
0 |
0 |
0 |
0 |
1 |
1 |
1 |
1 |
1 |
1 |
0% |
|
Petroleum Refining
Plants |
|
|
4 |
4 |
4 |
4 |
4 |
4 |
4 |
5 |
5 |
5 |
0% |
|
Other Comb. &
Trans. |
|
|
10 |
10 |
7 |
4 |
2 |
1 |
1 |
1 |
1 |
1 |
0% |
|
Comb. in
Comm/Inst/Res |
|
|
|
|
|
|
|
|
|
|
|
|
|
|
Residential Plant |
|
|
797 |
818 |
760 |
739 |
591 |
464 |
485 |
471 |
486 |
540 |
38% |
|
Comm/Pub/Agri Comb. |
|
|
32 |
29 |
19 |
20 |
19 |
16 |
17 |
18 |
7 |
3 |
0% |
|
Combustion in
Industry |
|
|
|
|
|
|
|
|
|
|
|
|
|
|
Iron & Steel
Comb. |
|
|
24 |
24 |
23 |
22 |
23 |
23 |
23 |
23 |
23 |
22 |
2% |
|
Other Ind. Comb. |
|
|
367 |
418 |
497 |
415 |
396 |
326 |
251 |
220 |
143 |
166 |
12% |
|
Production
Processes |
|
|
|
|
|
|
|
|
|
|
|
|
|
|
Non-Ferrous Metals |
|
|
3490 |
3354 |
3219 |
3083 |
2947 |
2307 |
735 |
432 |
394 |
277 |
20% |
|
Processes in
Industry |
|
|
106 |
98 |
90 |
84 |
86 |
86 |
86 |
86 |
85 |
81 |
6% |
|
Solvent Use |
|
|
103 |
103 |
103 |
103 |
103 |
103 |
103 |
103 |
103 |
103 |
7% |
|
Road Transport |
|
|
|
|
|
|
|
|
|
|
|
|
|
|
Combustion |
|
|
267 |
262 |
253 |
232 |
214 |
193 |
175 |
156 |
135 |
114 |
8% |
|
Brake & Tyre
Wear |
|
|
0 |
0 |
0 |
0 |
0 |
0 |
0 |
0 |
0 |
0 |
0% |
|
Other Trans/Mach |
|
|
9 |
9 |
9 |
9 |
8 |
7 |
6 |
5 |
4 |
4 |
0% |
|
Waste |
|
|
1 |
1 |
1 |
1 |
1 |
1 |
1 |
0 |
0 |
0 |
0% |
|
Agriculture |
|
|
933 |
800 |
582 |
12 |
0 |
0 |
0 |
0 |
0 |
0 |
0% |
|
Nature |
|
|
95 |
95 |
95 |
95 |
95 |
95 |
95 |
95 |
95 |
95 |
7% |
|
TOTAL |
|
|
6243 |
6030 |
5667 |
4829 |
4492 |
3629 |
1985 |
1617 |
1485 |
1414 |
100% |
|
|
|
Emissions of BaP2
(tonnes) |
|
|
1970 |
1980 |
1990 |
1991 |
1992 |
1993 |
1994 |
1995 |
1996 |
1997 |
1998 |
1999 |
1999% |
|
BY UN/ECE
CATEGORY |
|
|
|
|
|
|
|
|
|
|
|
|
|
|
Comb. in Energy
Prod. |
|
|
|
|
|
|
|
|
|
|
|
|
|
|
Public Power |
|
|
0.0 |
0.0 |
0.0 |
0.0 |
0.0 |
0.0 |
0.0 |
0.0 |
0.0 |
0.0 |
0% |
|
Public Power (Waste
Incin) |
|
|
0.0 |
0.0 |
0.0 |
0.0 |
0.0 |
0.0 |
0.0 |
0.0 |
0.0 |
0.0 |
0% |
|
Petroleum Refining
Plants |
|
|
0.0 |
0.0 |
0.0 |
0.0 |
0.0 |
0.0 |
0.0 |
0.0 |
0.0 |
0.0 |
0% |
|
Other Comb. &
Trans. |
|
|
0.1 |
0.1 |
0.1 |
0.0 |
0.0 |
0.0 |
0.0 |
0.0 |
0.0 |
0.0 |
0% |
|
Comb. in
Comm/Inst/Res |
|
|
|
|
|
|
|
|
|
|
|
|
|
|
Residential Plant |
|
|
6.3 |
6.5 |
6.0 |
5.8 |
4.5 |
3.4 |
3.6 |
3.4 |
3.6 |
4.0 |
26% |
|
Comm/Pub/Agri Comb. |
|
|
0.3 |
0.2 |
0.2 |
0.2 |
0.2 |
0.1 |
0.1 |
0.2 |
0.1 |
0.0 |
0% |
|
Combustion in
Industry |
|
|
|
|
|
|
|
|
|
|
|
|
|
|
Iron & Steel
Comb. |
|
|
0.3 |
0.3 |
0.3 |
0.3 |
0.3 |
0.3 |
0.3 |
0.3 |
0.3 |
0.3 |
2% |
|
Other Ind. Comb. |
|
|
3.3 |
3.7 |
4.4 |
3.7 |
3.5 |
2.9 |
2.2 |
2.0 |
1.3 |
1.5 |
9% |
|
Production
Processes |
|
|
|
|
|
|
|
|
|
|
|
|
|
|
Non-Ferrous Metals |
|
|
24.6 |
23.7 |
22.7 |
21.8 |
20.8 |
16.3 |
5.2 |
3.9 |
3.0 |
2.1 |
13% |
|
Processes in
Industry |
|
|
1.2 |
1.2 |
1.1 |
1.0 |
1.0 |
1.0 |
1.0 |
1.0 |
1.0 |
1.0 |
6% |
|
Solvent Use |
|
|
0.1 |
0.1 |
0.1 |
0.1 |
0.1 |
0.1 |
0.1 |
0.1 |
0.1 |
0.1 |
0% |
|
Road Transport |
|
|
|
|
|
|
|
|
|
|
|
|
|
|
Combustion |
|
|
9.2 |
9.1 |
8.8 |
8.1 |
7.4 |
6.7 |
6.0 |
5.3 |
4.5 |
3.9 |
24% |
|
Brake & Tyre
Wear |
|
|
0.0 |
0.0 |
0.0 |
0.0 |
0.0 |
0.0 |
0.0 |
0.0 |
0.0 |
0.0 |
0% |
|
Other Trans/Mach |
|
|
0.3 |
0.3 |
0.3 |
0.3 |
0.3 |
0.2 |
0.2 |
0.2 |
0.1 |
0.1 |
1% |
|
Waste |
|
|
0.0 |
0.0 |
0.0 |
0.0 |
0.0 |
0.0 |
0.0 |
0.0 |
0.0 |
0.0 |
0% |
|
Agriculture |
|
|
28.3 |
24.3 |
17.7 |
0.4 |
0.0 |
0.0 |
0.0 |
0.0 |
0.0 |
0.0 |
0% |
|
Nature |
|
|
2.9 |
2.9 |
2.9 |
2.9 |
2.9 |
2.9 |
2.9 |
2.9 |
2.9 |
2.9 |
18% |
|
TOTAL |
|
|
76.9 |
72.3 |
64.4 |
44.4 |
40.9 |
33.9 |
21.6 |
19.2 |
16.9 |
15.8 |
100% |
- The PAHs selected are listed above in
Table 6.3
- Benzo[a]pyrene
Figure 6.2 UK Emissions of 16 PAHs (ktonnes)
Figure 6.3 UK Emissions of Benzo[a]Pyrene (ktonnes)
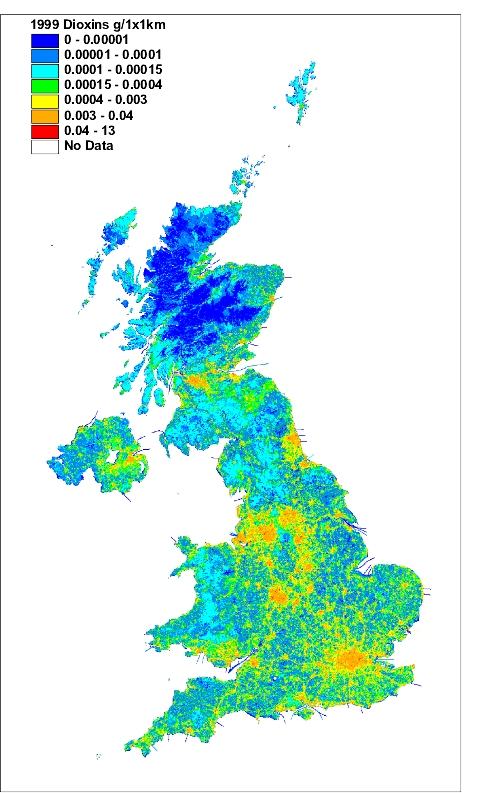
Dioxins and Furans (PCDD/F)
The term "dioxin" is used to refer to the
polychlorinated dibenzo-p-dioxins (PCDD) and "furan" is used for
polychlorinated dibenzofurans (PCDF). Although there are 210 PCDD/F compounds
in total, the emissions of importance are those of the 17 congeners (7 PCDDs
and 10 PCDFs) as defined by the NATO/CCMS (Committee on the Challenges of
Modern Society 1988) international toxic equivalent (I-TEQ) scheme. TEQ schemes
weight the toxicity of the less toxic congeners as fractions of the toxicity of
2,3,7,8-TCDD, the most toxic congener. The inventory is in terms of the sum of
the weighted emissions expressed as ‘I-TEQs’ which are widely used in
UK and European legislation. However, more recently the World Health
Organisation (WHO) has suggested a modification to the values used to calculate
the toxic equivalents for some of the PCDDs and PCDFs. They have also suggested
that there is value in using a similar approach for the PCBs which have
dioxin-like toxicity and combining the PCDD/F and PCB TEQs together. The
International and the WHO toxic equivalence factors (TEFs) for PCDD/Fs are
shown in Table 6.5
Table 6.5 The International and the WHO Toxic Equivalence Factors for
PCDD/Fs
(the differences are highlighted)
|
Dioxins |
International TEFs |
WHO TEFs |
|
2,3,7,8
tetraetrachlorodibenzo-p-dioxin |
1 |
1 |
|
1,2,3,7,8
pentachlorodibenzo-p-dioxin |
0.5 |
1 |
|
1,2,3,4,7,8
hexachlorodibenzo-p-dioxin |
0.1 |
0.1 |
|
1,2,3,6,7,8
hexachlorodibenzo-p-dioxin |
0.1 |
0.1 |
|
1,2,3,7,8,9
hexachlorodibenzo-p-dioxin |
0.1 |
0.1 |
|
1,2,3,4,6,7,8
heptachlorodibenzo-p-dioxin |
0.01 |
0.01 |
|
Octachlorodibenzo-p-dioxin |
0.001 |
0.0001 |
|
Furans |
|
|
|
2,3,7,8
tetra4chlorodibenzofuran |
0.1 |
0.1 |
|
1,2,3,7,8
pentachlorodibenzofuran |
0.05 |
0.05 |
|
2,3,4,7,8
pentachlorodibenzofuran |
0.5 |
0.5 |
|
1,2,3,4,7,8
hexachlorodibenzofuran |
0.1 |
0.1 |
|
1,2,3,6,7,8
hexachlorodibenzofuran |
0.1 |
0.1 |
|
1,2,3,7,8,9
hexachlorodibenzofuran |
0.1 |
0.1 |
|
2,3,4,6,7,8
hexachlorodibenzofuran |
0.1 |
0.1 |
|
1,2,3,4,6,7,8
heptachlorodibenzofuran |
0.01 |
0.01 |
|
1,2,3,4,7,8,9
heptachlorodibenzofuran |
0.01 |
0.01 |
|
Octachlorodibenzofuran |
0.001 |
0.0001 |
1 NATO/CCMS
(1988)
2 WHO (1998)
PCDD/Fs have been shown to possess a number of toxicological properties.
The major concern is centred on their possible role in immunological and
reproductive effects. The main sources of PCDD/Fs are thermal processes, but
they can also be released to the environment from some chemical processes.
PCDD/Fs can arise from any thermal process where chlorine, is present in
any form. For example, coal and other solid fuels contain trace amounts of
chlorine compounds which can under certain combustion conditions result in
PCDD/F formation. In addition PCDD/Fs can themselves be present in the feed
stock material, or chlorinated impurities may be introduced into the feed stock
of some thermal processes. The amount of chlorine required for PCDD/F formation
may be small and consequently many processes have the potential to emit these
pollutants. PCDD/Fs can also be emitted from the chemical production and use of
polychlorinated aromatic pesticides and herbicides, many of which are now
controlled. However, some chlorinated organic chemicals such as the wood
preservative pentachlorophenol are still used in the UK and these have the
potential to be sources of PCDD/Fs e.g. from the combustion of treated
wood.
The PCDD/F emission estimates for 1990-1995 are derived from emission
factors which have been revised to reflect changes in the degree of
implementation of abatement and of industry structure as a result of measures
taken by industry.
The estimated PCDD/F emissions for 1990-1999 are summarised in Table 6.6
below.
Table 6.6 UK emissions of PCDD/Fs (grammes TEQ/year)
|
|
1970 |
1980 |
1990 |
1991 |
1992 |
1993 |
1994 |
1995 |
1996 |
1997 |
1998 |
1999 |
1999% |
|
BY UN/ECE CATEGORY |
|
|
|
|
|
|
|
|
|
|
|
|
|
|
Comb. in Energy
Prod. |
|
|
|
|
|
|
|
|
|
|
|
|
|
|
Public Power |
|
|
35 |
35 |
32 |
27 |
25 |
24 |
22 |
18 |
18 |
16 |
5% |
|
Public Power (Waste
Incin) |
|
|
101 |
102 |
125 |
173 |
242 |
199 |
98 |
12 |
4 |
3 |
1% |
|
Petroleum Refining
Plants |
|
|
12 |
13 |
13 |
14 |
14 |
14 |
14 |
14 |
14 |
12 |
4% |
|
Other Comb. &
Trans. |
|
|
0 |
0 |
0 |
0 |
0 |
0 |
0 |
0 |
0 |
0 |
0% |
|
Comb. in
Comm/Inst/Res |
|
|
|
|
|
|
|
|
|
|
|
|
|
|
Residential Plant |
|
|
74 |
75 |
73 |
74 |
71 |
67 |
68 |
66 |
66 |
67 |
19% |
|
Comm/Pub/Agri Comb. |
|
|
53 |
51 |
46 |
39 |
34 |
26 |
28 |
31 |
23 |
23 |
7% |
|
Combustion in
Industry |
|
|
|
|
|
|
|
|
|
|
|
|
|
|
Iron & Steel
Comb. |
|
|
50 |
49 |
48 |
48 |
48 |
48 |
48 |
49 |
47 |
45 |
13% |
|
Non-Ferrous Metals |
|
|
25 |
22 |
23 |
24 |
23 |
22 |
23 |
22 |
21 |
21 |
6% |
|
Glass Production |
|
|
0 |
0 |
0 |
0 |
0 |
0 |
0 |
0 |
0 |
0 |
0% |
|
Other Ind. Comb. |
|
|
68 |
70 |
72 |
69 |
68 |
64 |
61 |
58 |
56 |
59 |
17% |
|
Production
Processes |
|
|
|
|
|
|
|
|
|
|
|
|
|
|
Iron & Steel |
|
|
31 |
26 |
28 |
29 |
29 |
30 |
28 |
30 |
26 |
17 |
5% |
|
Non-Ferrous Metals |
|
|
6 |
6 |
5 |
5 |
5 |
5 |
5 |
5 |
5 |
5 |
1% |
|
Processes in Industry |
|
|
5 |
5 |
4 |
4 |
3 |
3 |
3 |
3 |
3 |
3 |
1% |
|
Solvent Use |
|
|
0 |
0 |
0 |
0 |
0 |
0 |
0 |
0 |
0 |
0 |
0% |
|
Road Transport |
|
|
|
|
|
|
|
|
|
|
|
|
|
|
Combustion |
|
|
29 |
26 |
23 |
20 |
18 |
16 |
14 |
11 |
8 |
5 |
2% |
|
Vehicle Fires |
|
|
6 |
6 |
6 |
6 |
6 |
7 |
7 |
7 |
7 |
7 |
2% |
|
Other Trans/Mach |
|
|
1 |
1 |
1 |
1 |
1 |
1 |
1 |
1 |
1 |
0 |
0% |
|
Waste |
|
|
|
|
|
|
|
|
|
|
|
|
|
|
Landfill |
|
|
2 |
2 |
2 |
2 |
2 |
2 |
2 |
2 |
2 |
2 |
0% |
|
Waste Incineration |
|
|
581 |
579 |
556 |
508 |
357 |
285 |
160 |
49 |
53 |
54 |
16% |
|
Other Waste Treat. &
Disp. |
|
|
0 |
0 |
0 |
0 |
0 |
0 |
0 |
0 |
0 |
0 |
0% |
|
Agriculture |
|
|
57 |
49 |
36 |
1 |
0 |
0 |
0 |
0 |
0 |
0 |
0% |
|
Nature |
|
|
6 |
6 |
6 |
6 |
6 |
6 |
6 |
6 |
6 |
6 |
2% |
|
TOTAL |
|
|
1142 |
1123 |
1098 |
1049 |
953 |
819 |
589 |
384 |
361 |
346 |
100% |
Figure 6.4 UK Emissions of PCDD/Fs (grammes TEQ)
Previously the largest sources of PCDD/F emission was waste
incineration. However, emissions have fallen rapidly from 1993 to 1999.
Emissions from waste incineration in 1999 are more than an order of magnitude
lower than those in 1990. This significant trend has been driven by the
introduction of control measures. MSW incinerators not meeting the new
standards closed in the period leading up to December 1996. New designs of MSW
incinerator result in significantly lower levels of PCDD/F emissions.
Figure 6.5 Spatially Disaggregated UK Emissions of PCDD/F
The relatively low emissions from chemical incinerators reflects the use
of rotary kilns and the incorporation of a secondary combustion chamber in the
process to destroy organic contaminants together with the relatively low waste
throughput and advanced pollution abatement equipment. However, clinical waste
incineration remains a significant source. This is due to the fact that
emissions from clinical waste incinerators (although showing significant
reductions) have not been reducing as rapidly as the total PCDD/F total.
Emissions from power stations are fairly low because the combustion is
efficient and the post-combustion fly ash temperatures are rapidly reduced. The
emission factors associated with industrial and domestic coal combustion are
significantly higher and sum to give a similar contribution, even though the
coal consumption is less. However, emissions from all three sectors have
decreased with the reduction in the quantity of coal burned.
Emissions from accidental fires and open agricultural burning are
included in the Nature and Agricultural sector. The latter has greatly
decreased since the cessation of most agricultural burning. Accidental fires
are currently treated as a source of constant magnitude, and consequently, the
percentage contribution from this sector to the total PCDD/F emission has risen
as emissions from other significant sectors have decreased.
There are significant emissions from sinter plants owing more to the
large gas volumes emitted than to high concentrations. Emissions from iron and
steel plant are probably underestimated since only electric arc furnaces are
considered. Scrap used in electric arc furnaces and secondary non-ferrous metal
production will contain chlorinated impurities such as plastics and cutting oil
which contribute to PCDD/F formation.
It is generally accepted that the source of PCDD/F emissions from road
transport are the 1,2-dichloroethane scavengers added to leaded petrol. Over
recent years both the consumption of leaded petrol, and the lead content of
leaded petrol has decreased. Consequently the emissions of PCDD/F from this
sector have decreased. Unleaded petrol and diesel is likely to contain only
trace quantities of chlorinated impurities. For 1999, the contribution to the
PCDD/F emission total from road transport was 4%.
Polychlorinated biphenyls (PCBs)
PCBs are synthetic organic compounds that have mainly
been used in electrical equipment as dielectric insulating media.
PCBs have been linked with subtle sub-chronic effects such as reduced
male fertility and long-term behavioural and learning impairment- they are
classified as probably carcinogenic to humans. Certain PCBs have been assessed
as having dioxin-like effects. PCBs are extremely persistent in the environment
and possess the ability to accumulate in the food chain. These compounds are
highly insoluble in water but accumulate in body fat. Present human exposure is
probably dominated by the accumulation through the food chain of the PCBs
present in environmental reservoirs such as soils and sediments as a result of
previous releases to the environment.
PCBs have not been manufactured and used in the UK for many years, but
old PCB-containing equipment still exist. It is estimated that 81% of primary
PCB emissions to the atmosphere are associated with such appliances. These
emissions primarily arise from in-service appliances; however emissions during
disposal are also considered to be significant. Large quantities of PCBs are
thought to have been disposed of to landfill in the past, mainly in the form of
electrical components or fragmentiser residues, but now such equipment
containing PCBs are disposed of by chemical incineration. PCBs are also emitted
from the soil having previously been deposited there from the air.
PCB speciation has been incorporated into the emission estimates since
the 1998 inventory. A summary of the total PCB emission estimates for 1990 to
1999 is given below in Table 6.7 (detailed emission estimates are give in
Appendix 8). In addition TEQs for PCBs are included in Appendix 8 for the first
time.
Table 6.7 - Summary of PCB Emissions in the UK (kg)
|
|
1970 |
1980 |
1990 |
1991 |
1992 |
1993 |
1994 |
1995 |
1996 |
1997 |
1998 |
1999 |
1999% |
|
BY UN/ECE CATEGORY |
|
|
|
|
|
|
|
|
|
|
|
|
|
|
Comb. in Energy
Prod. |
|
|
|
|
|
|
|
|
|
|
|
|
|
|
Public Power |
|
|
89 |
88 |
82 |
68 |
55 |
53 |
48 |
46 |
44 |
38 |
2% |
|
Public Power (Waste
Incin) |
|
|
2 |
2 |
2 |
3 |
5 |
5 |
4 |
5 |
5 |
5 |
0% |
|
Other Comb. &
Trans. |
|
|
4 |
1 |
4 |
4 |
4 |
4 |
3 |
4 |
4 |
4 |
0% |
|
Comb. in
Comm/Inst/Res |
|
|
|
|
|
|
|
|
|
|
|
|
|
|
Residential Plant |
|
|
23 |
25 |
22 |
24 |
20 |
15 |
15 |
16 |
16 |
17 |
1% |
|
Comm/Pub/Agri Comb. |
|
|
1 |
1 |
1 |
1 |
1 |
1 |
1 |
1 |
1 |
0 |
0% |
|
Combustion in
Industry |
|
|
|
|
|
|
|
|
|
|
|
|
|
|
Iron & Steel
Comb. |
|
|
38 |
37 |
37 |
36 |
37 |
37 |
38 |
39 |
39 |
40 |
2% |
|
Other Ind. Comb. |
|
|
6231 |
5727 |
5223 |
4719 |
4215 |
3710 |
3205 |
2701 |
2196 |
1692 |
82% |
|
Production
Processes |
|
|
|
|
|
|
|
|
|
|
|
|
|
|
Iron & Steel |
|
|
491 |
419 |
438 |
458 |
428 |
394 |
373 |
387 |
400 |
243 |
12% |
|
Processes in Industry |
|
|
1 |
1 |
1 |
1 |
1 |
0 |
0 |
0 |
0 |
0 |
0% |
|
Waste |
|
|
|
|
|
|
|
|
|
|
|
|
|
|
Landfill |
|
|
1 |
1 |
1 |
1 |
1 |
1 |
1 |
1 |
1 |
1 |
0% |
|
Waste Incineration |
|
|
12 |
12 |
12 |
11 |
8 |
7 |
6 |
2 |
2 |
1 |
0% |
|
Other Waste Treat. &
Disp. |
|
|
80 |
81 |
78 |
81 |
73 |
64 |
55 |
46 |
38 |
29 |
1% |
|
Agriculture |
|
|
1 |
1 |
1 |
0 |
0 |
0 |
0 |
0 |
0 |
0 |
0% |
|
TOTAL |
|
|
6976 |
6397 |
5901 |
5407 |
4846 |
4292 |
3750 |
3248 |
2747 |
2071 |
100% |
Figure 6.6 UK Emissions of PCBs (kg)
Sales of PCBs in the UK were stopped in 1986, though it is thought that
they are still manufactured in some countries. The total PCB emission in 1990
was dominated by leaks from capacitors (89% of total emission), and this is the
case for 1999 (82% contribution). However, not all electrical equipment
containing PCBs is readily identifiable. Emissions from electrical equipment
will probably continue, and will only start to fall significantly as the
relevant electrical equipment is either destroyed or reaches the end of its
working life.
In 1997 an Action Plan was published by DETR (now DEFRA) which laid out
how the commitments made by the UK at the Third International North Sea
Conference at the Hague in 1991 and in accordance with the requirements of
Directive 96/59/EC. Regulations now require all PCB holders in the UK to report
their stocks to the relevant regulatory bodies. These stocks (except for
certain exemptions) should have been destroyed by the end of December 2000.
PCBs can be formed in trace amounts from chlorinated precursors in
thermal processes such as scrap metal recycling. As a result, there are
significant emissions from the iron and steel industrial sector, as with
PCDD/Fs.
PCBs occur in sewage sludge due to their persistent nature. Not all the
PCBs spread on land will volatilise but the potential for emissions to air is
greater than that of landfill. The emission estimate comprises only 1% of the
total and is highly uncertain. Emissions arise from waste incineration and
refuse derived fuel production result from the PCB content of the waste.
Pesticide Emissions
There is little available information to enable
accurate estimates of pesticide emissions to air. The emissions estimates
presented here follow from significant improvements to the earlier emission
estimates first made in 1996.
Despite these improvements, the confidence in the accuracy of these
estimates is low. Relevant data is currently scarce with the majority of
emission factors coming from the USA or Europe. The emissions factors used here
will have been derived for a particular method of pesticide application and
during atmospheric conditions which may not be representative of the situation
in the UK. Until further data becomes available it is difficult to reduce the
uncertainty associated with these estimates.
Pesticide emissions to the air occur predominately through three
pathways: during manufacture, during application and volatilisation after
application. Tables 6.8, 6.9 and 6.10 show the estimated emissions of lindane
(g-HCH), pentachlorophenol (PCP)
and hexachlorobenzene (HCB) respectively.
Lindane (g HCH)
Lindane is applied as an insecticide and fungicide in agriculture and is
used for wood preservation and in domestic and veterinary formulations. Until
1990 lindane was also used as a remedial wood treatment i.e. in a curative role
rather than a preservative/preventative. However, data on quantities used for a
remedial wood treatment prior to 1990 are not available.
HCH exists in several isomers, however as a result of regulation in the
UK, g-HCH accounts for more than
99% of the total HCH use. Consequently only the g isomer has been considered in any
detail here. The emission estimates presented in Table 6.8a were made assuming
that emissions arise from: the application of g-HCH, treated wood and agricultural
and domestic use. g-HCH
emissions are dominated by emissions from treated wood and wood preserving
sources, contributing 66% and 14% to the 1999 total emission respectively.
Emissions from wood preserving are expected to fall.
Emissions from agricultural activities are also significant, accounting
for around 18% of total 1999 g-HCH emissions. These emissions are based on statistics giving the
use of pesticides containing lindane, obtained from the Pesticide Usage Survey
Group (MAFF, 1991a,b,c; 1992a,b,c,d) The emission factors used are taken from
van der Most et al (1989).
Emissions of g-HCH arising
from domestic applications are thought to be comparatively small. However,
usage statistics are scarce and were only available for 1988 ( DOE, 1989).
Emission factors are taken from van der Most et al (1989).
Table 6.8a - Summary of g-HCH Emissions in the UK (tonnes)
|
|
1970 |
1980 |
1990 |
1991 |
1992 |
1993 |
1994 |
1995 |
1996 |
1997 |
1998 |
1999 |
1999% |
|
BY UN/ECE CATEGORY |
|
|
|
|
|
|
|
|
|
|
|
|
|
|
Solvent Use |
|
|
|
|
|
|
|
|
|
|
|
|
|
|
Treated Wood |
|
|
57 |
51 |
46 |
41 |
37 |
33 |
30 |
27 |
24 |
22 |
66% |
|
Wood Preserving |
|
|
36 |
28 |
21 |
17 |
13 |
10 |
8 |
6 |
5 |
5 |
14% |
|
Agriculture |
|
|
|
|
|
|
|
|
|
|
|
|
|
|
Domestic Pesticide
Use |
|
|
1 |
1 |
1 |
1 |
1 |
1 |
1 |
1 |
1 |
1 |
2% |
|
Agriculture Pesticide |
|
|
6 |
6 |
6 |
6 |
6 |
6 |
6 |
6 |
6 |
6 |
18% |
|
TOTAL |
|
|
99 |
85 |
74 |
65 |
57 |
50 |
45 |
40 |
36 |
33 |
100% |
Figure 6.7 UK Emissions of g-HCH (tonnes)
For completeness, the total emissions of HCH are also included here (see
Table 6.8b below), although the differences are obscured due to rounding. These
total HCH emissions estimates assume the worst case scenario of 1% contribution
from non g isomers to the HCH
total.
Table 6.8b - Summary of Total HCH Emissions in the UK (tonnes)
|
|
1970 |
1980 |
1990 |
1991 |
1992 |
1993 |
1994 |
1995 |
1996 |
1997 |
1998 |
1999 |
1999% |
|
BY UN/ECE CATEGORY |
|
|
|
|
|
|
|
|
|
|
|
|
|
|
Solvent Use |
|
|
|
|
|
|
|
|
|
|
|
|
|
|
Treated Wood |
|
|
57 |
52 |
46 |
42 |
38 |
34 |
30 |
27 |
25 |
22 |
66% |
|
Wood Preserving |
|
|
36 |
28 |
22 |
17 |
13 |
10 |
8 |
6 |
5 |
5 |
14% |
|
Agriculture |
|
|
|
|
|
|
|
|
|
|
|
|
|
|
Domestic Pesticide
Use |
|
|
1 |
1 |
1 |
1 |
1 |
1 |
1 |
1 |
1 |
1 |
2% |
|
Agriculture Pesticide |
|
|
6 |
6 |
6 |
6 |
6 |
6 |
6 |
6 |
6 |
6 |
18% |
|
TOTAL |
|
|
100 |
86 |
75 |
65 |
57 |
51 |
45 |
40 |
36 |
34 |
100% |
Pentachlorophenol (PCP)
Pentachlorophenol is used as a biocide, and is effective in destroying
insect eggs. It is used in the timber and textile industries. The emission
estimates given here also include emissions of sodium pentachlorophenoxide
(NaPCP) and pentachlorophenyl laureate (PCPL) as well as PCP since these are
also included in the proprietary formulations.
The estimated PCP emissions for 1990 to 1999 are given in Table 6.9. The
largest percentage contribution to the total 1999 PCP emission arises from wood
that has been treated within the last 15 years. This accounts for some 89% of
the 1999 total PCP emission.
Once again it is very difficult to be certain of these estimates due to
the lack of research into emission rates and limited knowledge of quantities
used both in the year of the estimate and in previous years. An emission factor
of 3% of the wood content per year was used- the same method used for
lindane.
PCP emissions from the textile industry primarily arise from
volatilisation during application as a cotton preservative. Emission factors
used were based on a study of PCP emissions in the UK (Wild, 1992) who report
that approximately 30% of the applied PCP is lost through volatilisation.
Emissions from this sector are comparatively small.
PCP is used in the agricultural sector as the active ingredient in
disinfecting wooden trays used in mushroom farming. Usage statistics are
reliable coming from the Pesticide Usage Survey Group (MAFF, 1991a,b,c;
1992a,b,c,d). The emission factor assumes 30% loss due to volatilisation (Wild,
1992). Emissions from this sector are comparatively small.
Table 6.9 - Summary of PCP Emissions in the UK (tonnes)
|
|
1970 |
1980 |
1990 |
1991 |
1992 |
1993 |
1994 |
1995 |
1996 |
1997 |
1998 |
1999 |
1999% |
|
BY UN/ECE CATEGORY |
|
|
|
|
|
|
|
|
|
|
|
|
|
|
Comb. in Energy
Prod. |
|
|
0.1 |
0.1 |
0.1 |
0.1 |
0.2 |
0.2 |
0.1 |
0.1 |
0.1 |
0.1 |
0% |
|
Comb. in
Comm/Inst/Res |
|
|
0.0 |
0.0 |
0.0 |
0.0 |
0.0 |
0.0 |
0.0 |
0.0 |
0.0 |
0.0 |
0% |
|
Combustion in
Industry |
|
|
0.0 |
0.0 |
0.0 |
0.0 |
0.0 |
0.0 |
0.0 |
0.0 |
0.0 |
0.0 |
0% |
|
Production
Processes |
|
|
0.0 |
0.0 |
0.0 |
0.0 |
0.0 |
0.0 |
0.0 |
0.0 |
0.0 |
0.0 |
0% |
|
Solvent Use |
|
|
|
|
|
|
|
|
|
|
|
|
0% |
|
Textile Coating |
|
|
3.0 |
3.0 |
3.0 |
3.0 |
0.0 |
0.0 |
0.0 |
0.0 |
0.0 |
0.0 |
0% |
|
NaPCP Treated Wood |
|
|
3.6 |
3.6 |
3.6 |
1.8 |
1.8 |
1.8 |
1.8 |
1.8 |
1.8 |
1.8 |
0% |
|
PCP Treated Wood in
Use |
|
|
474.5 |
474.5 |
474.5 |
474.5 |
466.6 |
458.9 |
451.5 |
444.3 |
437.3 |
430.6 |
89% |
|
PCP Treated Wood |
|
|
6.2 |
6.2 |
6.2 |
0.0 |
0.0 |
0.0 |
0.0 |
0.0 |
0.0 |
0.0 |
0% |
|
PCP in Imported Wood |
|
|
50.0 |
50.0 |
50.0 |
50.0 |
50.0 |
50.0 |
50.0 |
50.0 |
50.0 |
50.0 |
10% |
|
Road Transport |
|
|
0.0 |
0.0 |
0.0 |
0.0 |
0.0 |
0.0 |
0.0 |
0.0 |
0.0 |
0.0 |
0% |
|
Other Trans/Mach |
|
|
0.0 |
0.0 |
0.0 |
0.0 |
0.0 |
0.0 |
0.0 |
0.0 |
0.0 |
0.0 |
0% |
|
Waste |
|
|
0.4 |
0.4 |
0.3 |
0.3 |
0.2 |
0.2 |
0.1 |
0.0 |
0.0 |
0.0 |
0% |
|
Agriculture |
|
|
0.2 |
0.2 |
0.2 |
0.0 |
0.0 |
0.0 |
0.0 |
0.0 |
0.0 |
0.0 |
0% |
|
TOTAL |
|
|
538 |
538 |
538 |
530 |
519 |
511 |
503 |
496 |
489 |
482 |
100% |
Figure 6.8 UK Emissions of PCP (tonnes)
The emission inventory for PCP is very uncertain as limited emission
factors are available on the release of PCP during agricultural activities and
statistics are not actively collected on the extent of its usage. There is some
data on release of PCP from combustion processes, but the available studies are
not consistent with each other suggesting that the uncertainty may be
considerable. However combustion processes are not significant sources.
Hexachlorobenzene (HCB)
Studies in the USA have identified two main industrial sources of HCB
(Mumma et al, 1975) (Jacoff et al, 1986). These are the
manufacture of chlorinated solvents (e.g. trichloroethylene,
tetrachloroethylene and carbon tetrachloride) and the manufacture of specific
pesticides where HCB remains as an impurity. HCB emissions can also result from
the use of hexachloroethane tablets as a degassing agent in secondary aluminium
melting (van der Most et al, 1992). HCB emissions may also arise from
combustion sources, but other than waste incineration these could not be
estimated though they are believed to be small.
Statistics for chlorinated solvent production in the UK are commercially
confidential, hence estimates were made based on UK solvent usage data from the
Solvent Industries Association and import and export statistics.
Although there is no UK manufacture of pesticides that results in the
production of HCB, pesticides with HCB as an impurity are still imported and
used in the UK for agricultural pest control. Statistics for the use of these
pesticides is provided by the Pesticide Usage Survey Group (MAFF, 1991a,b,c;
1992a,b,c,d).
HCB emissions in secondary aluminium melting result from the use of
hexachloroethane (HCE) tablets as a degassing agent. Regulations now control
the use of HCE and so very little secondary aluminium is now melted using HCE.
Estimates of the quantity of degassing agent supplied and industrial expert
estimates of the quantity of HCE used per tonne of aluminium melted were used
to estimate the total aluminium melted using HCE.
Emission factors for HCB from solvent production, pesticide manufacture
and aluminium smelting are taken from van der Most et al (1989).
Emissions from chlorinated solvent production and pesticide application
are the most significant sources in the UK (Table 6.10) and in 1999 were
estimated to account for 29% and 70%, respectively, of the total HCB emissions.
This represents a significant change in the relative contributions to the total
for 1990 where the same sectors contributed 46% and 43% respectively. This
change is a direct result of the reduced emissions from the production of
chlorinated solvents, but only very small changes are noted between more recent
years.
Table 6.10 - Summary of HCB Emissions in the UK (tonnes)
|
|
1970 |
1980 |
1990 |
1991 |
1992 |
1993 |
1994 |
1995 |
1996 |
1997 |
1998 |
1999 |
1999% |
|
BY UN/ECE CATEGORY |
|
|
|
|
|
|
|
|
|
|
|
|
|
|
Combustion in
Industry |
|
|
0.10 |
0.10 |
0.12 |
0.12 |
0.10 |
0.11 |
0.11 |
0.11 |
0.11 |
0.00 |
0% |
|
Production
Processes |
|
|
|
|
|
|
|
|
|
|
|
|
|
|
Pentachlorophenol
Production |
|
|
0.03 |
0.03 |
0.03 |
0.01 |
0.01 |
0.01 |
0.01 |
0.01 |
0.01 |
0.01 |
1% |
|
Picloram Production |
|
|
0.00 |
0.00 |
0.00 |
0.00 |
0.00 |
0.00 |
0.00 |
0.00 |
0.00 |
0.00 |
0% |
|
Carbon Tetrachloride
Producn. |
|
|
0.36 |
0.36 |
0.36 |
0.36 |
0.36 |
0.36 |
0.36 |
0.14 |
0.14 |
0.14 |
18% |
|
Tetrachloroethylene
Producn. |
|
|
0.08 |
0.08 |
0.08 |
0.08 |
0.08 |
0.08 |
0.08 |
0.03 |
0.03 |
0.03 |
4% |
|
Trichloroethylene
Production |
|
|
0.14 |
0.14 |
0.14 |
0.14 |
0.14 |
0.14 |
0.14 |
0.05 |
0.05 |
0.05 |
7% |
|
Waste |
|
|
0.01 |
0.01 |
0.01 |
0.01 |
0.00 |
0.00 |
0.00 |
0.00 |
0.00 |
0.00 |
0% |
|
Agriculture |
|
|
|
|
|
|
|
|
|
|
|
|
|
|
Pesticides
(Chlorothalonil) |
|
|
0.47 |
0.47 |
0.47 |
0.47 |
0.47 |
0.47 |
0.47 |
0.47 |
0.47 |
0.47 |
60% |
|
Pesticides
(Chlorthal-dimethyl) |
|
|
0.08 |
0.08 |
0.08 |
0.08 |
0.08 |
0.08 |
0.08 |
0.08 |
0.08 |
0.08 |
10% |
|
Pesticides
(Quintozine) |
|
|
0.00 |
0.00 |
0.00 |
0.00 |
0.00 |
0.00 |
0.00 |
0.00 |
0.00 |
0.00 |
0% |
|
TOTAL |
|
|
1.27 |
1.26 |
1.28 |
1.26 |
1.24 |
1.25 |
1.24 |
0.89 |
0.89 |
0.79 |
100% |
Figure 6.9 UK Emissions of HCB (tonnes)
Short Chained Chlorinated Paraffins
(SCCP)
Introduction
Short chain chlorinated paraffins (SCCPs) are a range of commercially
available chlorinated paraffins with 10-13 carbon atoms. The commercial
products are usually mixtures of different carbon chain paraffins with a range
of different degrees of chlorination. SCCPs are considered persistent organic
pollutants- they do not occur naturally and due to their bioaccumulative and
toxicological properties they are of concern to the environment.
Production and Emissions to Air
SCCPs are currently manufactured in the EU and are marketed under a
variety of trade names with an average chlorine content of 40-74%. Current
production in the EU is thought to be in the region of 15,000 tonnes per
year.
The main uses of SCCPs are in the metal working, rubber manufacture,
paint, sealant, leather and textile industries. However, it has been reported
that there are negligible emissions to air of SCCP from production sources, and
releases from the majority of industrial consumption results in emissions
primarily to water (with very low emissions to air). Emissions from waste water
to the atmosphere are unlikely to be large due to the physical properties of
SCCPs.
The most important source of emission of SCCPs in the EU is considered
to be the leather industry. There is some confusion concerning the leather
finishing industry. The confusion concerns whether finishing agents are
prepared by sulphonation of SCCPs or if they are prepared as mixtures of SCCPs
and sulphonated compounds. It has been reported that it is more likely that the
finishing agents are mixtures of sulphonated compounds and SCCPs. Assuming that
this is correct the emissions are most likely to come from use of the SCCP and
sulphonated material mixtures and from the formulation process.
Emission Estimates
It has been reported that the use of SCCP in the leather industry in the
UK is between 1 and 2 tonnes per year. By assuming the emissions of SCCP are
proportional to use of SCCP in the leather industry and using the estimated
release from leather industry in the EU it is possible to make an estimate of
the release to air in the UK. The estimated SCCP emission to air for the UK is
1.5 kg/year.
It should be appreciated that there is considerable uncertainty
associated with this estimate. An alternative estimation method gives a UK
emissions of 62 kg/year. Until more data is available on the emissions from the
individual industrial sectors it is not possible to determine an emission
estimate with any confidence.
Improvements that can be made to the UK release inventory for SCCP are
shown below:
- Undertake a more thorough literature search.
- Obtain any relevant emissions testing reports from the trade bodies
concerned with the leather, textiles and paint industries.
- Further investigate the emissions from treated leather and textiles
during use.
These areas will be investigated for future reports.
Polychlorinated Napthalenes (PCN)
Introduction
Polychlorinated Napthalenes (PCNs) are a group of 75 theoretically
possible chlorinated naphthalenes containing between one and eight chlorine
atoms. Their chemical structure is similar to that of PCBs. PCNs are widely
considered be associated with cancer and chronic liver disease.
PCNs have been used in a variety of industries. The most important uses
are Cable insulation, wood preservation, engine oil additives, electroplating
masking compounds, feedstock for dye production, dye carriers, capacitors and
refractive testing oils.
PCNs have been produced in a number of countries including the UK, USA
and France, their synonyms and trade names include Halowax, Nibren waxes,
Seekay Waxes, Cerifal Materials and N-Oil. The majority of production generates
a standard mixture of the different PCN congeners.
Production and Consumption
A number of assumptions give an estimate of the world-wide PCN
production as 150,000 tonnes. Similar assumptions can be made to estimate the
UK production as 6,650 tonnes.
Emission Estimates
There is very little information concerning the production of PCNs for
commercial purposes.
Commercially produced PCNs are thought to be the most important source
of PCNs in the atmosphere with the other source sectors being thermal sources,
other industrial processes and contamination in PCB industrially produced
mixtures.
In recent years production of PCNs has stopped (1960’s or 70s) so
the major releases that were present during their extensive use have decreased.
The potential sources at present are expected to be dominated by the disposal
routes of capacitors and engine oil in the past (this is where the majority of
the PCNs produced are thought to have been used). Another potential source of
PCNs may be the incineration industry, PCNs have been found in fly ash and flue
gas in waste incinerators. Similarly landfill is expected to be a source of PCN
emissions.
PCNs have been found in emissions from incinerators and are thought to
be produced from the combustion of PAHs. Therefore PCNs could in theory be
produced from other high temperature combustion processes. A full review of
emission measurements from such processes would be required prior to
ascertaining the scale of the emissions of PCNs from such a potentially large
array of sources.
As the information regarding the emission of PCNs in the UK is
relatively sparse, it is not currently realistic to quote an emission estimate
for PCNs.
Polybrominated Diphenyl Ethers (PBDEs)
Introduction
There are 209 possible congeners of polybrominated diphenyl ethers
(PBDEs). Concern about potential risks to human health and the environment has
centred on the potential toxicity, persistence and the tendency for
bioaccumulation of some brominated diphenyls.
Since the 1960s, PBDEs have been added as flame-retardants. They are
used in a variety of materials (Strandman et al. 2000), including
thermoplastics (e.g. high-impact polystyrene) that are used in electrical
equipment, computer circuit boards, casings, upholstery, furnishings; interiors
in cars, buses, trucks and aeroplanes, rugs, drapery and building
materials.
Production and Releases to Air
The annual EU production of polybrominated diphenyl ethers has been
estimated to be 11,000 tonnes per year. It has been reported (EU 2000) that the
UK used up to 2,000 tonnes of polybrominated biphenyl in 1994. Production of
the three commercial mixtures (penta-, octa- and deca-dibrominated diphenyl)
has virtually ceased in the EU.
The possible routes of release of PBDEs vary from production to the
disposal of the materials for which they are used. There is limited information
concerning the releases and it is difficult to attempt to estimate an emission
inventory without any measurements of releases from sources or potential
sources. Attempts have been made to gather UK usage information. However,
information is not easily accessible, particularly as PBDEs are a material used
in such a wide variety of industries.
Emission Estimate
It has not been possible to obtain UK specific emission data for PBDEs,
but an estimate of the UK emission of PBDEs has been made using the total EU
estimate. This is done by scaling with population. Without further assessment
of the potential emissions from materials such as plastic and upholstery during
production use and disposal it is not possible to make a more accurate
estimate. The resulting unspeciated UK emission estimate for PBDE’s is
13.8 tonnes per year.
There are a number of improvements that can be made to the UK emission
estimate. Resources should be focussed on the following aspects of production
and use of secondary products that contain PBDEs.
- Emission from manufacturing sites
- Releases from materials during use
- Release from materials during and following disposal
These areas will be investigated to inform future reports.