Figure 5.8 Emissions Profile for Hydrogen Chloride
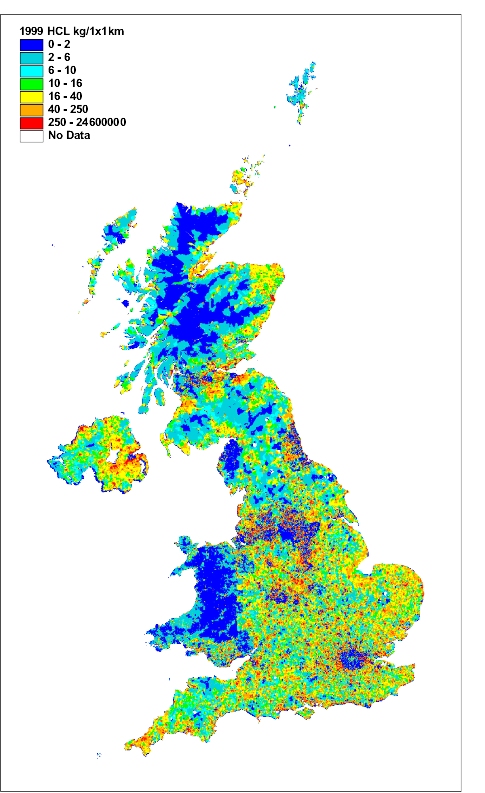
Figure 5.9, Spatially Disaggregated UK Emissions of HCl

Hydrogen chloride emission estimates
HCl is an acidic gas primarily released to air from combustion of fuels which contain trace amounts of chloride. This results in the emissions of HCl being dominated by the combustion of solid fuel.
Table 5.5 and Figure 5.8 summarise the UK emissions of hydrogen chloride. Emissions have fallen by 71% since 1970. The main source of these emissions is coal combustion so the fall is a result of the decline in coal use and also the installation of flue gas desulphurisation at Drax and Ratcliffe since 1993. The other significant source of hydrogen chloride is waste incineration. Here the commissioning of new incinerators and the closure or upgrading of old plant has resulted in a large decrease for all years since 1996.
Table 5.5 UK Emissions of Hydrogen Chloride by UN/ECE Source Category and Fuel (kt)
|
1970 |
1980 |
1990 |
1991 |
1992 |
1993 |
1994 |
1995 |
1996 |
1997 |
1998 |
1999 |
1999% |
|
|
BY UN/ECE CATEGORY1 |
|||||||||||||
|
Comb. in Energy Prod. |
|||||||||||||
|
Public Power |
222.3 |
257.8 |
239.4 |
237.9 |
223.9 |
187.7 |
170.5 |
133.2 |
109.4 |
74.5 |
76.7 |
82.2 |
84% |
|
Petroleum Refining Plants |
0.0 |
0.0 |
0.0 |
0.0 |
0.0 |
0.0 |
0.0 |
0.0 |
0.0 |
0.0 |
0.0 |
0.0 |
0% |
|
Other Comb. & Trans. |
4.5 |
1.6 |
0.3 |
0.3 |
0.2 |
0.1 |
0.1 |
0.0 |
0.0 |
0.0 |
0.0 |
0.0 |
0% |
|
Comb. in Comm/Inst/Res |
|||||||||||||
|
Residential Plant |
47.3 |
21.0 |
10.0 |
11.2 |
9.8 |
10.9 |
9.2 |
6.3 |
6.4 |
6.1 |
5.6 |
6.3 |
6% |
|
Comm/Pub/Agri Comb. |
9.9 |
4.3 |
2.9 |
2.7 |
2.2 |
2.0 |
1.7 |
1.2 |
1.4 |
1.5 |
0.9 |
0.8 |
1% |
|
Combustion in Industry |
|||||||||||||
|
Iron & Steel Comb. |
2.0 |
0.4 |
0.1 |
0.1 |
0.1 |
0.1 |
0.1 |
0.1 |
0.1 |
0.1 |
0.1 |
0.1 |
0% |
|
Other Ind. Comb. |
38.9 |
13.3 |
13.7 |
15.2 |
17.1 |
16.2 |
15.1 |
14.0 |
11.8 |
10.8 |
8.6 |
8.4 |
9% |
|
Production Processes |
0.1 |
0.1 |
0.1 |
0.1 |
0.1 |
0.1 |
0.1 |
0.1 |
0.1 |
0.1 |
0.1 |
0.1 |
0% |
|
Road Transport |
0.4 |
0.4 |
0.1 |
0.1 |
0.1 |
0.1 |
0.1 |
0.1 |
0.1 |
0.0 |
0.0 |
0.0 |
0% |
|
Other Trans/Mach2 |
0.0 |
0.0 |
0.0 |
0.0 |
0.0 |
0.0 |
0.0 |
0.0 |
0.0 |
0.0 |
0.0 |
0.0 |
0% |
|
Waste |
10.6 |
10.6 |
8.8 |
8.8 |
8.4 |
7.6 |
5.0 |
5.2 |
4.9 |
0.0 |
0.1 |
0.1 |
0% |
|
By FUEL TYPE |
|||||||||||||
|
Solid |
324.0 |
297.8 |
264.0 |
265.0 |
250.5 |
213.2 |
190.6 |
148.5 |
122.8 |
91.7 |
90.6 |
96.7 |
99% |
|
Petroleum |
0.7 |
0.6 |
0.2 |
0.2 |
0.2 |
0.2 |
0.2 |
0.1 |
0.1 |
0.1 |
0.1 |
0.1 |
0% |
|
Gas |
0.0 |
0.0 |
0.0 |
0.0 |
0.0 |
0.0 |
0.0 |
0.0 |
0.0 |
0.0 |
0.0 |
0.0 |
0% |
|
Non-Fuel |
11.3 |
11.2 |
11.3 |
11.2 |
11.2 |
11.3 |
11.2 |
11.7 |
11.2 |
1.4 |
1.5 |
1.3 |
1% |
|
TOTAL |
336 |
310 |
275 |
276 |
262 |
225 |
202 |
160 |
134 |
93 |
92 |
98 |
100% |
1 See Appendix 4 for definition of UN/ECE Categories
2 Including railways, shipping, naval vessels, military aircraft and off-road sources
Figure 5.8 Emissions Profile for Hydrogen Chloride
Figure 5.9, Spatially Disaggregated UK Emissions of HCl