
Historically, interest in particulate matter focused mainly on smoke which can cause health problems especially in combination with other pollutants. The classic example was emissions of smoke and sulphur dioxide leading to the London smogs in the 1950s and early 1960s when several thousand excess deaths were recorded. Smoke emissions have fallen significantly as a result of the Clean Air Acts eliminating domestic coal combustion in many urban areas. However, there is increasing interest in the measurement of fine particles, such as those arising from the combustion of diesel fuel in the transport sector, and aerosol concentrations in the atmosphere from other sources which may have harmful effects. Recent epidemiological evidence is also linking concentrations of particles in the atmosphere with human health effects. Indeed, current ambient mass concentrations are thought to be sufficient to lead to increased mortality and morbidity (EPAQS, 1995).
Particles can vary widely in size and composition. Particles larger than about 30 m m fall rapidly under gravity and those larger than about 100 m m fall out of the atmosphere so rapidly they are not usually considered. At the other end of the size scale are particles less than a tenth of a m m which are so small they do not fall under gravity appreciably, but coagulate to form larger particles that are then removed from the atmosphere.
The US PM10 standard was a monitoring standard designed to measure the mass of particles less than 10 m m in size (more strictly, particles that pass through a size selective inlet with a 50% efficiency cut-off at 10 m m aerodynamic diameter). This corresponds to the International Standards Organisation thoracic convention for classifying those particles likely to be inhaled into the thoracic region of the respiratory tract. The epidemiological evidence of the effects of particulates shows good correlation in the UK between PM10 concentrations and mortality or morbidity (EPAQS 1995, 2001). Therefore PM10 has become the generally accepted measure of particulate material in the atmosphere in the UK and in Europe. There is also an increasing interest in the correlation between PM2.5 and health indicators. PM10 measurements are being made in the UK (Bower et al, 1994, 1995 a & b, 1996, 1997) and their emissions have been included in the NAEI since 1995.
For many years the monitoring of particulate levels was based on the measurement of "Black Smoke". Levels were estimated using a simple non-gravimetric reflectance method in which air is sampled through a filter and the resulting blackening measured. The method was calibrated for domestic coal smoke. When most of the emissions come from coal combustion the blackening should be approximately proportional to the mass concentrations. In the 50s and 60s, domestic coal combustion was the dominant source of black smoke and hence this method gave an indication of the concentration. The NAEI estimates of black smoke emissions were extended in 1988 to include emissions from all fuel combustion. Prior to 1988 only emissions from coal combustion had been estimated and published in the DOE Digest of Environmental Statistics. However, there have been no recent emission measurements to confirm these factors are still accurate.
Smoke from different sources has a different blackening effect and so there is no simple relationship between black smoke and the mass of particulate emissions. For example, typically diesel emissions have a blackening effect three times greater, mass for mass, than coal emissions, while petrol emissions are effectively an order of magnitude less. Black smoke is a poor indicator of the concentrations of particulates in the atmosphere current interest and the NAQS is focused on PM10 (particulate matter less than 10
mm i.e. 10 millionths of a metre) and smaller size fractions (EPAQS, 1995). However, black smoke has been shown to have relationships with health effects and is still used as an indicator.For completeness the following sections present emission estimates and discussion for PM10 , PM2.5 , PM1.0 , PM0.1 and Black Smoke.
Sources of emissions
PM10 in the atmosphere arises from two sources. The first is the direct emission of particulate matter into the atmosphere from a wide range of sources such as fuel combustion, surface erosion and wind blown dusts and mechanical break-up in, for example, quarrying and construction sites. These are called ‘primary’ particulates. The second source is the formation of particulate matter in the atmosphere through the reactions of other pollutants such as sulphur dioxide, nitrogen oxides and ammonia to form solid sulphates and nitrates, as well as organic aerosols formed from the oxidation of VOCs. These are called ‘secondary’ particulates. This inventory only considers primary sources. For further information on secondary particulate see the third Quality of Urban Air Review Group report (QUARG, 1996) and the report from the Airborne Particles Expert Group (APEG, 1999).
There is currently a programme sponsored by DEFRA and the Society of Motor Manufacturers and Traders (SMMT) to measure PM10 emissions from road transport. This programme has developed measurement techniques and aims to produce improved PM10 emission factors, particulate characterisation and particle size distribution.
The main sources of primary PM10 are briefly described below:
PM10 Emission estimates
Emissions of PM10 are shown in Table 4.3 and Figure 4.1. Emissions of PM10 from the UK have declined since 1970. This is due mainly to the reduction in coal use. Domestic emissions have fallen from 223 tonnes (42% of the total emission) in 1970 to 38 tonnes (20%) in 1999.
Emission estimates for the resuspension of dust from roads is not included in the standard UN/ECE reporting format (and hence not included in Table 4.3). However for completeness it is given in Table 4.4 below. Estimates for resuspension are based on the deposition of primary particles form all UK sources (including vehicle tailpipes and from brake and tyre wear) that are returned to the air from the turbulence of passing vehicles. As such, resuspension to some extent double counts the emissions, but is important in reconciling road side concentration measurements.
Table 4.3 UK Emissions of PM10 by UN/ECE Source Category and Fuel (kt)
|
1970 |
1980 |
1990 |
1991 |
1992 |
1993 |
1994 |
1995 |
1996 |
1997 |
1998 |
1999 |
1999% |
|
|
BY UN/ECE CATEGORY1 |
|||||||||||||
|
Comb. in Energy Prod. |
|||||||||||||
|
Public Power |
67 |
76 |
70 |
70 |
66 |
55 |
49 |
37 |
34 |
23 |
23 |
19 |
10% |
|
Petroleum Refining Plants |
5 |
5 |
3 |
4 |
4 |
4 |
4 |
4 |
4 |
4 |
4 |
3 |
2% |
|
Other Comb. & Trans. |
16 |
3 |
3 |
3 |
3 |
3 |
3 |
3 |
4 |
4 |
4 |
4 |
2% |
|
Comb. in Comm/Inst/Res |
|||||||||||||
|
Residential Plant |
223 |
105 |
55 |
58 |
53 |
54 |
45 |
35 |
37 |
34 |
35 |
38 |
20% |
|
Comm/Pub/Agri Comb. |
22 |
11 |
8 |
8 |
7 |
7 |
7 |
6 |
6 |
7 |
5 |
5 |
3% |
|
Combustion in Industry |
|||||||||||||
|
Iron & Steel Comb. |
8 |
2 |
1 |
1 |
1 |
1 |
1 |
1 |
1 |
1 |
1 |
1 |
0% |
|
Other Ind. Comb. |
69 |
32 |
28 |
29 |
31 |
30 |
29 |
26 |
24 |
22 |
20 |
18 |
10% |
|
Production Processes |
|||||||||||||
|
Processes in Industry |
14 |
12 |
13 |
13 |
13 |
13 |
13 |
13 |
13 |
13 |
12 |
11 |
6% |
|
Construction |
8 |
3 |
4 |
4 |
3 |
3 |
3 |
4 |
4 |
4 |
4 |
4 |
2% |
|
Quarrying |
22 |
21 |
29 |
26 |
25 |
25 |
27 |
26 |
23 |
24 |
23 |
21 |
11% |
|
Road Transport |
|||||||||||||
|
Combustion |
44 |
53 |
59 |
58 |
55 |
53 |
52 |
47 |
44 |
39 |
35 |
32 |
17% |
|
Brake & Tyre Wear |
2 |
3 |
4 |
4 |
4 |
4 |
4 |
4 |
5 |
5 |
5 |
5 |
3% |
|
Other Trans/Mach |
15 |
13 |
12 |
12 |
12 |
12 |
12 |
11 |
12 |
11 |
11 |
11 |
6% |
|
Waste |
1 |
4 |
3 |
3 |
3 |
2 |
3 |
2 |
2 |
1 |
1 |
1 |
1% |
|
Agri. & Land Use Change |
11 |
12 |
12 |
13 |
12 |
12 |
12 |
12 |
13 |
13 |
14 |
14 |
8% |
|
By FUEL TYPE |
|||||||||||||
|
Solid |
360 |
200 |
139 |
143 |
135 |
124 |
107 |
84 |
80 |
68 |
64 |
62 |
33% |
|
Petroleum |
95 |
86 |
82 |
82 |
79 |
77 |
74 |
68 |
65 |
58 |
53 |
48 |
26% |
|
Gas |
4 |
7 |
9 |
10 |
10 |
10 |
11 |
11 |
12 |
12 |
13 |
13 |
7% |
|
Non-Fuel |
68 |
62 |
75 |
70 |
67 |
67 |
71 |
68 |
67 |
67 |
68 |
64 |
34% |
|
TOTAL |
528 |
355 |
305 |
304 |
292 |
278 |
263 |
232 |
225 |
204 |
197 |
186 |
100% |
1 See Appendix 4 for definition of UN/ECE Categories
Table 4.4 PM10 Emission Estimates from Resuspension
|
1970 |
1980 |
1990 |
1991 |
1992 |
1993 |
1994 |
1995 |
1996 |
1997 |
1998 |
1999 |
|
|
Resuspension from Road Trans |
8.2 |
11.2 |
16.8 |
17.0 |
16.8 |
16.9 |
17.4 |
17.8 |
18.3 |
18.5 |
18.9 |
18.9 |
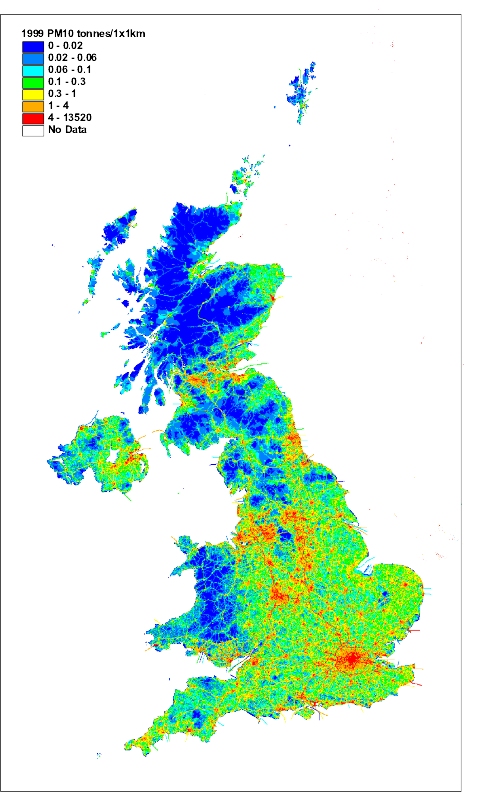
The geographical disaggregation of emissions is shown in Figure 4.2. There is a clear distinction between the important sources in rural and urban areas. Indeed, many of the sources do not occur inside towns and cities. While road transport accounts for only 20% of national emissions, it can account for up to 80% of primary emissions in urban areas such as London (Buckingham et. al., 1997).
Emissions from electricity generation have also recently been declining (since 1991) despite a significant growth in the electricity generated between 1970 and 1999. This is due to the move away from coal to natural gas and nuclear power for electricity generation and to improvements in the performance of electrostatic precipitators at coal-fired power stations. Also the installation of flue gas desulphurisation at two power stations have reduced particulate emissions further.
Figure 4.1 UK Emissions of PM10
The one sector which has shown significant relative growth in emissions since 1970 is road transport, with a contribution to the total UK emission rising from 13% in 1970 to 20% in 1999. In urban areas with little industrial activity, where public power and industrial processes do not make a significant contribution, the contribution of road transport to emissions will be even higher; for example as much as 80% of primary emissions in London. The main source of road transport emissions is exhaust from diesel engined vehicles. Emissions from diesel vehicles have been growing due to the growth in heavy duty vehicle traffic and the move towards more diesel cars, (diesel cars have increased from 3% to 12% of the UK vehicle fleet across 1990 to 1999). Since around 1992, however, emissions from diesel vehicles have been decreasing due to the penetration of new vehicles meeting tighter PM10 emission regulations.
Among the non-combustion and transport sources, the major emissions are from a range of industrial processes and quarrying whose emission rates have remained fairly constant.
Figure 4.2, Spatially Disaggregated UK Emissions of PM10
Finer particulates: PM2.5, PM1 and PM0.1
Inventories for PM2.5, PM1 and PM0.1 have been estimated from the PM10 inventory and the mass fractions in these size ranges available for different emission sources and fuel types. A total of 33 different size distributions covering PM2.5 and PM1 emissions from different source sectors were taken from the USEPA (1995) as being applicable to sources in the UK; a fewer number of sectors with size fractions in the PM0.1 range were available from the study by the TNO Institute of Environmental Sciences, Energy Research and Process Innovation in the Netherlands for the Dutch National Institute of Public Health and Environment (RIVM) (TNO, 1997) who produced a particulates emissions inventory for Europe. In general, combustion processes emit a higher proportion of fine particles (<2.5 µ m) than mechanical sources such as quarrying and construction. Gaseous fuels also tend to emit finer particles than petroleum and solid fuels.
Each of the detailed source sectors for which a PM10 emission is estimated (a total of 236 individual sectors and sub-sectors) were allocated an appropriate size distribution and used to calculate emission inventories for PM2.5, PM1 and PM0.1. The results are shown in Tables 4.5-4.7 in the same format as for the PM10 inventory.
Figures 4.3-4.5 show trends in emissions of each particle size by source sector. The results show a comparable decline in emissions of each particle size since 1990, although the smaller size fractions indicate less of a decrease. Between 1990 and 1999, UK emissions of PM10 fell by 39%, whereas emissions of PM2.5 fell by 36%, PM1 by 33% and PM0.1 by 32%. There is a gradual change in the relative source contribution with particle size. This is illustrated in Figures 4.2 to 4.5 which show the contribution of each sector to PM10, PM2.5, PM1 and PM0.1 emissions from 1990 to 1999. Road transport becomes an increasingly important sector as the particle size decreases. In 1999, it accounted for 20% of PM10 emissions, but 46% of PM0.1 emissions. The increased contribution of traffic to emissions of the finer particles also explains why the finer particles have shown a smaller fall in UK emissions between 1990 and 1999. Emissions from non-combustion sources show the opposite trend.
Table 4.5 UK emissions of PM2.5 by sector (ktonnes) estimated for the mass fraction of particles below 2.5 µ m in each sector in the PM10 inventory
|
1990 |
1991 |
1992 |
1993 |
1994 |
1995 |
1996 |
1997 |
1998 |
1999 |
1999% |
|
|
Comb. in Energy Prod/Trans |
36 |
36 |
34 |
30 |
27 |
22 |
21 |
16 |
17 |
14 |
13% |
|
Comb. in Comm/Inst/Resid |
29 |
31 |
29 |
29 |
25 |
21 |
23 |
22 |
22 |
23 |
20% |
|
Combustion in Industry |
19 |
20 |
21 |
20 |
19 |
17 |
16 |
15 |
13 |
12 |
11% |
|
Production Processes |
19 |
18 |
17 |
18 |
18 |
18 |
17 |
17 |
17 |
15 |
14% |
|
Road Transport |
53 |
52 |
50 |
48 |
47 |
44 |
41 |
36 |
33 |
30 |
27% |
|
Other Transport |
12 |
12 |
12 |
12 |
12 |
11 |
12 |
12 |
12 |
11 |
10% |
|
Waste Treatment & Disposal |
3 |
2 |
2 |
2 |
3 |
2 |
2 |
1 |
1 |
1 |
1% |
|
Agriculture/Forestry |
5 |
5 |
4 |
4 |
4 |
4 |
4 |
4 |
4 |
5 |
4% |
|
TOTAL |
176 |
176 |
171 |
162 |
156 |
140 |
137 |
124 |
119 |
112 |
100% |
Table 4.6 UK Emissions of PM1 by Sector (ktonnes) Estimated for the Mass Fraction of Particles below 1 µ m in each Sector in the PM10 Inventory
|
1990 |
1991 |
1992 |
1993 |
1994 |
1995 |
1996 |
1997 |
1998 |
1999 |
1999% |
|
|
Comb. in Energy Prod/Trans |
17 |
17 |
17 |
15 |
14 |
12 |
12 |
10 |
10 |
9 |
11% |
|
Comb. in Comm/Inst/Resid |
21 |
22 |
21 |
20 |
17 |
15 |
17 |
16 |
16 |
17 |
20% |
|
Combustion in Industry |
9 |
9 |
10 |
9 |
9 |
8 |
7 |
7 |
6 |
6 |
7% |
|
Production Processes |
10 |
9 |
9 |
9 |
9 |
9 |
9 |
9 |
9 |
8 |
10% |
|
Road Transport |
47 |
46 |
44 |
43 |
42 |
39 |
36 |
32 |
28 |
26 |
32% |
|
Other Transport |
11 |
11 |
11 |
10 |
10 |
10 |
11 |
10 |
11 |
10 |
12% |
|
Waste Treatment & Disposal |
2 |
2 |
2 |
2 |
2 |
2 |
2 |
1 |
1 |
1 |
2% |
|
Agriculture/Forestry |
5 |
5 |
4 |
4 |
4 |
4 |
4 |
4 |
4 |
5 |
6% |
|
TOTAL |
121 |
121 |
118 |
112 |
108 |
98 |
98 |
89 |
86 |
81 |
100% |
Table 4.7 UK Emissions of PM0.1 by Sector (ktonnes) Estimated for the Mass Fraction of Particles below 0.1 µ m in each Sector in the PM10 Inventory
|
1990 |
1991 |
1992 |
1993 |
1994 |
1995 |
1996 |
1997 |
1998 |
1999 |
1999% |
|
|
Comb. in Energy Prod/Trans |
7 |
7 |
7 |
6 |
6 |
5 |
5 |
4 |
5 |
4 |
13% |
|
Comb. in Comm/Inst/Resid |
3 |
3 |
3 |
3 |
3 |
3 |
3 |
3 |
3 |
3 |
9% |
|
Combustion in Industry |
4 |
4 |
4 |
4 |
4 |
3 |
3 |
3 |
3 |
3 |
8% |
|
Production Processes |
1 |
1 |
1 |
1 |
1 |
1 |
1 |
1 |
1 |
1 |
3% |
|
Road Transport |
25 |
25 |
24 |
23 |
23 |
21 |
20 |
18 |
16 |
15 |
46% |
|
Other Transport |
3 |
3 |
3 |
2 |
2 |
2 |
3 |
3 |
3 |
2 |
7% |
|
Waste Treatment & Disposal |
0 |
0 |
0 |
0 |
0 |
0 |
0 |
0 |
0 |
0 |
1% |
|
Agriculture/Forestry |
4 |
4 |
4 |
4 |
4 |
4 |
4 |
4 |
4 |
5 |
14% |
|
TOTAL |
48 |
48 |
46 |
44 |
44 |
41 |
40 |
36 |
35 |
32 |
100% |
Figure 4.3 UK emissions of PM2.5
Figure 4.4 UK emissions of PM1
Figure 4.5 UK emissions of PM0.1
The UK emissions of black smoke are shown in Table 4.8. Emissions have declined over the period 1970-1999 by 75%. The most significant cause of the reduction is the decline in the use of solid fuels in the domestic sector. Up until the late eighties, domestic emissions were the most important contribution to the total, however since then emissions from road transport have dominated and currently account for 48% of the total. Road transport emissions rose by over a factor of 2 from 1970 to the first half of the 1990s, the emission largely composed of emissions from diesel engines. Road transport emissions have declined since 1992 due to stricter regulations on diesel engines. Emissions from off-road sources have been estimated from estimates of the amount of diesel oil and petrol consumed by these machines. These emissions account for 12% of the UK total. The decline in agricultural emissions up to 1993 is due to the banning of stubble burning.
Table 4.8 UK Emissions of Black Smoke by UN/ECE Source Category and Fuel (kt)
|
1970 |
1980 |
1990 |
1991 |
1992 |
1993 |
1994 |
1995 |
1996 |
1997 |
1998 |
1999 |
1999% |
|
|
BY UN/ECE CATEGORY1 |
|||||||||||||
|
Comb. in Energy Prod. |
|||||||||||||
|
Public Power |
32 |
29 |
34 |
34 |
34 |
32 |
34 |
37 |
33 |
33 |
16 |
15 |
5% |
|
Petroleum Refining Plants |
4 |
4 |
2 |
3 |
3 |
3 |
3 |
3 |
3 |
3 |
3 |
2 |
1% |
|
Other Comb. & Trans. |
3 |
1 |
0 |
0 |
0 |
0 |
0 |
0 |
0 |
0 |
0 |
0 |
0% |
|
Comb. in Comm/Inst/Res |
|||||||||||||
|
Residential Plant |
770 |
316 |
137 |
144 |
129 |
127 |
94 |
63 |
67 |
63 |
66 |
78 |
29% |
|
Comm/Pub/Agri Comb. |
15 |
8 |
4 |
4 |
4 |
4 |
4 |
3 |
3 |
3 |
2 |
2 |
1% |
|
Combustion in Industry |
|||||||||||||
|
Iron & Steel Comb. |
7 |
2 |
1 |
1 |
1 |
1 |
1 |
1 |
1 |
1 |
1 |
1 |
0% |
|
Other Ind. Comb. |
37 |
19 |
13 |
13 |
13 |
13 |
12 |
10 |
9 |
8 |
7 |
6 |
2% |
|
Production Processes |
1 |
0 |
0 |
0 |
0 |
0 |
0 |
0 |
0 |
0 |
0 |
0 |
0% |
|
Road Transport |
99 |
117 |
204 |
203 |
211 |
205 |
208 |
196 |
189 |
176 |
152 |
130 |
48% |
|
Other Trans/Mach |
|||||||||||||
|
Off-Road Sources |
45 |
39 |
34 |
35 |
35 |
34 |
33 |
32 |
34 |
33 |
33 |
32 |
12% |
|
Other2 |
4 |
4 |
4 |
4 |
4 |
4 |
3 |
3 |
3 |
3 |
3 |
3 |
1% |
|
Waste |
44 |
44 |
37 |
37 |
35 |
28 |
18 |
22 |
18 |
1 |
1 |
2 |
1% |
|
Agricul/ Land Use Change |
11 |
17 |
10 |
9 |
6 |
0 |
0 |
0 |
0 |
0 |
0 |
0 |
0% |
|
By FUEL TYPE |
|||||||||||||
|
Solid |
821 |
349 |
168 |
174 |
158 |
151 |
117 |
84 |
86 |
81 |
82 |
93 |
34% |
|
Petroleum |
197 |
189 |
259 |
259 |
266 |
259 |
259 |
245 |
239 |
221 |
196 |
172 |
64% |
|
Gas |
0 |
0 |
0 |
0 |
0 |
0 |
0 |
0 |
0 |
0 |
0 |
0 |
0% |
|
Non-Fuel |
55 |
61 |
54 |
53 |
51 |
40 |
34 |
42 |
35 |
21 |
5 |
6 |
2% |
|
TOTAL |
1073 |
600 |
481 |
486 |
474 |
450 |
410 |
371 |
360 |
323 |
284 |
271 |
100% |
1 See Appendix 4 for definition of UN/ECE Categories
2 Including railways, shipping, naval vessels, military aircraft
It is likely that emissions of black smoke have fallen more than is indicated by these estimates as a result of improved abatement measures on large combustion plant and stricter regulation on diesel engines. However, little data is available on these control measures, including their effect on the blackening effect of particulates which is crucial to the black smoke inventory, and only the diesel emission reductions have been estimated.