Figure 2.2 Time Series of CO2 Emissions
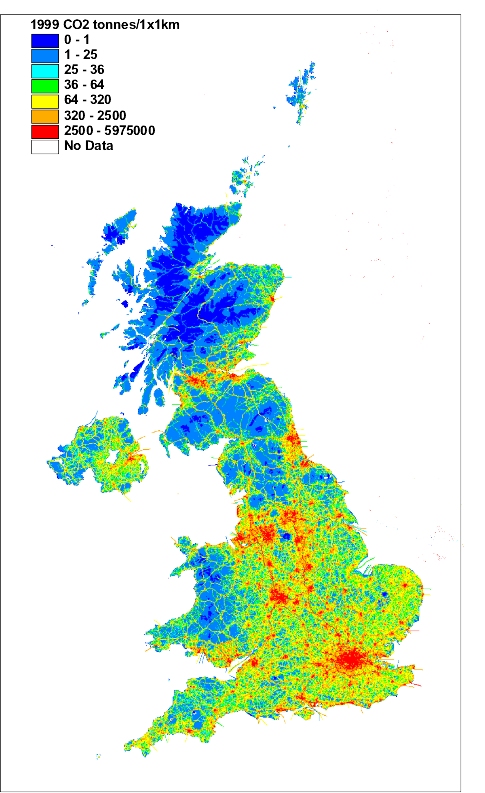
Figure 2.3, Spatially Disaggregated UK Emissions of CO2

Carbon dioxide emissions in 1999 have reduced by 22% since 1970, as shown in Figure 2.2. However, this decline has not been steady, and peaks were observed in 1973 and 1979 which were due to the state of the economy, high oil prices and severe winters in these years. Emissions fell again during the early eighties reflecting the recession during this period and the coal miners strike of 1984. Since the mid-1980s the emissions profile has been much smoother showing an overall reduction in emissions. There are small increases in several sectors. The elevated emission from the domestic sector in 1996 is considered to be due to the colder than average winter (indicated by lower than average mean air temperatures).
The major emissions of carbon dioxide arise from the combustion of fossil fuels in power generation, and the transport, domestic and industrial sectors (Figure 2.2, Table 2.2). The level of emissions depends on the fuel mix and the fuel consumption data. Details of UK fuel consumption are given annually in the Department of Trade and Industry's Digest of United Kingdom Energy Statistics (DTI, 1999, 2000). The fuel consumption data used to calculate the pollutant emission totals in the NAEI are given in Table 2.3; fuels which are used as feedstocks are omitted (principally natural gas used for the production of ammonia, methanol and acetic acid and some use of LPG and OPG in petrochemical plants).
Table 2.2 UK Emissions of CO2 as Carbon by UN/ECE1 Source Category and Fuel (Mt)
|
1970 |
1980 |
1990 |
1991 |
1992 |
1993 |
1994 |
1995 |
1996 |
1997 |
1998 |
1999 |
1999% |
|
|
BY UN/ECE CATEGORY2 |
|||||||||||||
|
Comb. in Energy Prod. |
|||||||||||||
|
Public Power |
57.0 |
58.3 |
54.1 |
53.3 |
50.4 |
45.5 |
44.4 |
44.1 |
43.5 |
39.6 |
40.6 |
38.5 |
27% |
|
Petroleum Refining Plants |
5.6 |
5.5 |
4.8 |
5.0 |
5.1 |
5.4 |
5.2 |
5.4 |
5.6 |
5.5 |
5.5 |
5.0 |
3% |
|
Other Comb. & Trans. |
8.2 |
2.9 |
3.8 |
3.8 |
3.8 |
3.8 |
4.4 |
4.8 |
5.2 |
5.3 |
5.8 |
5.9 |
4% |
|
Comb. in Comm/Inst/Res |
|||||||||||||
|
Residential Plant |
26.5 |
23.2 |
21.5 |
23.9 |
23.1 |
24.2 |
22.9 |
21.7 |
24.7 |
22.7 |
23.2 |
23.2 |
16% |
|
Comm/Pub/Agri Comb. |
12.3 |
9.9 |
8.4 |
9.2 |
9.0 |
8.8 |
8.7 |
8.8 |
9.3 |
8.6 |
8.5 |
8.3 |
6% |
|
Combustion in Industry |
|||||||||||||
|
Iron & Steel Comb. |
15.8 |
5.2 |
6.2 |
6.2 |
6.1 |
6.1 |
6.5 |
6.5 |
6.6 |
6.7 |
6.4 |
6.2 |
4% |
|
Other Ind. Comb. |
32.3 |
24.8 |
18.3 |
18.5 |
18.2 |
17.8 |
17.9 |
17.3 |
17.5 |
17.4 |
17.0 |
16.8 |
12% |
|
Production Processes |
4.9 |
4.0 |
4.1 |
3.3 |
3.2 |
3.3 |
3.5 |
3.5 |
3.7 |
3.6 |
3.4 |
3.7 |
3% |
|
Extr./Distrib. of Fossil Fuels |
0.1 |
0.1 |
0.4 |
0.2 |
0.2 |
0.1 |
0.2 |
0.2 |
0.2 |
0.2 |
0.2 |
0.2 |
0% |
|
Road Transport |
16.3 |
21.2 |
29.7 |
29.5 |
29.9 |
30.3 |
30.4 |
30.1 |
31.3 |
31.7 |
31.5 |
31.2 |
22% |
|
Other Trans/Mach |
|||||||||||||
|
Off-Road Sources |
2.3 |
2.0 |
1.7 |
1.8 |
1.8 |
1.8 |
1.7 |
1.7 |
1.7 |
1.7 |
1.7 |
1.6 |
1% |
|
Other3 |
3.3 |
3.3 |
3.6 |
3.3 |
3.3 |
3.3 |
3.1 |
3.1 |
3.2 |
3.0 |
2.9 |
2.8 |
2% |
|
Waste |
0.2 |
3.4 |
2.2 |
2.0 |
2.0 |
2.0 |
2.5 |
1.9 |
2.0 |
1.6 |
1.5 |
1.4 |
1% |
|
Land Use Change |
0.5 |
0.4 |
0.4 |
0.5 |
0.5 |
0.3 |
0.3 |
0.4 |
0.4 |
0.4 |
0.3 |
0.2 |
0% |
|
By FUEL TYPE |
|||||||||||||
|
Solid |
90.3 |
70.6 |
61.4 |
61.1 |
57.4 |
49.4 |
46.0 |
42.7 |
39.5 |
34.3 |
34.2 |
30.3 |
21% |
|
Petroleum |
67.9 |
54.7 |
53.2 |
53.1 |
53.3 |
53.3 |
52.1 |
50.6 |
51.9 |
49.7 |
48.5 |
46.7 |
32% |
|
Gas |
22.7 |
32.2 |
38.8 |
41.0 |
40.7 |
45.0 |
47.8 |
50.7 |
57.8 |
58.7 |
60.5 |
63.2 |
44% |
|
Non-Fuel |
4.5 |
6.8 |
6.1 |
5.3 |
5.2 |
4.9 |
5.9 |
5.5 |
5.6 |
5.4 |
5.3 |
5.0 |
3% |
|
TOTAL |
185.3 |
164.3 |
159.5 |
160.6 |
156.6 |
152.6 |
151.8 |
149.6 |
154.8 |
148.0 |
148.5 |
145.1 |
100% |
1 UK emissions reported in IPCC format (Salway, 2001) differ slightly due to the different source categories used.
2 See Appendix 4 for definition of UN/ECE Categories
3 Railways, civil aircraft, shipping, naval vessels and military aircraft.
Figure 2.2 Time Series of CO2 Emissions
Figure 2.3, Spatially Disaggregated UK Emissions of CO2
The electricity supply industry is the major consumer of fossil fuels, and hence the major source of carbon dioxide emissions in the UK (Tables 2.2 and 2.3). There have been significant changes in the generating mix between 1980 and 1999, as shown in Figure 2.4. The level of CO2 emissions is determined by both the fuel mix and the generating technology used. During the 1970s the electricity supply industry was dominated by coal and fuel oil fired thermal power stations, and coal and oil consumption increased to meet the rising demand for electricity. The use of coal for power generation peaked in 1980 at 89.6 Mt and has subsequently declined. The fall has not been steady, showing minima in 1982 and 1984 due to recession in the early 1980s and the miners strike of 1984. During the late 1980s and early 1990s, the closure of inefficient plant led to an overall increase in the thermal efficiency of the conventional thermal power plants, and the contribution of nuclear power generation increased with the greater utilisation of existing nuclear plants and the commissioning of Sizewell B in 1995. The use of oil generation peaked in 1972 and apart from increased consumption during the miners strike of 1984 has been in decline ever since. Two oil-fired stations were converted to burn Orimulsion® (an emulsion of bitumen and water) although this practice has been discontinued, largely on environmental grounds. More recently, the privatisation of the power industry has resulted in a move away from coal and oil generation towards combined cycle gas turbines (CCGT). The use of gas in power generation has increased by a factor of 47 since 1991. Further increases may be expected as and when more CCGT stations come on line.
Table 2.3 UK Fuel Consumption
|
Fuel |
Consumer |
1970 |
1980 |
1990 |
1991 |
1992 |
1993 |
1994 |
1995 |
1996 |
1997 |
1998 |
1999 |
|
|
Coal |
Major Power Prod. |
Mtonnes |
77 |
90 |
83 |
82 |
77 |
64 |
61 |
58 |
53 |
45 |
47 |
39 |
|
Coal |
Industry |
Mtonnes |
22 |
9 |
8 |
8 |
8 |
7 |
7 |
6 |
5 |
5 |
4 |
4 |
|
Coal |
Domestic |
Mtonnes |
20 |
9 |
4 |
5 |
4 |
5 |
4 |
3 |
3 |
3 |
2 |
3 |
|
Coal |
Others |
Mtonnes |
38 |
16 |
14 |
13 |
11 |
11 |
11 |
10 |
10 |
10 |
10 |
10 |
|
Other Solid Fuels |
All Consumers |
Mtonnes |
27 |
11 |
11 |
11 |
10 |
10 |
10 |
10 |
10 |
10 |
10 |
10 |
|
Motor Spirit |
Road Transport |
Mtonnes |
14 |
19 |
24 |
24 |
24 |
24 |
23 |
22 |
22 |
22 |
22 |
22 |
|
Gas Oil |
Road Transport |
Mtonnes |
5 |
6 |
11 |
11 |
11 |
12 |
13 |
13 |
14 |
15 |
15 |
15 |
|
Gas Oil |
Industry |
Mtonnes |
5 |
5 |
3 |
3 |
3 |
3 |
3 |
3 |
3 |
3 |
3 |
3 |
|
Gas Oil |
Others |
Mtonnes |
8 |
8 |
7 |
7 |
7 |
7 |
7 |
6 |
7 |
6 |
7 |
6 |
|
Fuel Oil |
Major Power Prod. |
Mtonnes |
12 |
6 |
6 |
6 |
4 |
3 |
2 |
2 |
2 |
1 |
1 |
1 |
|
Fuel Oil |
Refineries |
Mtonnes |
4 |
4 |
2 |
2 |
2 |
2 |
3 |
2 |
2 |
2 |
2 |
2 |
|
Fuel Oil |
Industry |
Mtonnes |
21 |
10 |
4 |
5 |
5 |
5 |
4 |
3 |
3 |
2 |
2 |
1 |
|
Fuel Oil |
Others |
Mtonnes |
15 |
6 |
4 |
4 |
4 |
4 |
4 |
4 |
4 |
4 |
4 |
3 |
|
Orimulsion |
Major Power Prod. |
Mtonnes |
0 |
0 |
0 |
0 |
1 |
1 |
1 |
1 |
1 |
0 |
0 |
0 |
|
Burning Oil |
Domestic |
Mtonnes |
2 |
2 |
2 |
2 |
2 |
2 |
2 |
2 |
3 |
3 |
3 |
2 |
|
Burning Oil |
Others |
Mtonnes |
4 |
0 |
0 |
1 |
1 |
1 |
1 |
1 |
1 |
1 |
1 |
1 |
|
Aviation Turbine Fuel |
Air Transport |
Mtonnes |
2 |
1 |
7 |
7 |
7 |
8 |
8 |
8 |
9 |
9 |
10 |
11 |
|
Other Pet. Products |
All Consumers |
Mtonnes |
1 |
1 |
1 |
1 |
2 |
2 |
2 |
2 |
2 |
2 |
2 |
2 |
|
Petroleum Gases |
Refineries |
Mtherms |
1011 |
987 |
1303 |
1271 |
1256 |
1337 |
1290 |
1382 |
1460 |
1378 |
1301 |
1252 |
|
Petroleum Gases |
Others |
Mtherms |
700 |
717 |
680 |
780 |
719 |
751 |
891 |
858 |
858 |
760 |
742 |
688 |
|
Natural Gas |
Major Power Prod. |
Mtherms |
60 |
55 |
3 |
7 |
396 |
2488 |
3606 |
4540 |
6029 |
7633 |
8087 |
9599 |
|
Natural Gas |
Industry |
Mtherms |
710 |
6616 |
7016 |
6850 |
6575 |
6765 |
7566 |
7967 |
8783 |
9152 |
9584 |
10096 |
|
Natural Gas |
Domestic |
Mtherms |
627 |
8420 |
10250 |
11395 |
11264 |
11607 |
11250 |
11124 |
12824 |
11790 |
12144 |
12150 |
|
Natural Gas |
Others |
Mtherms |
2206 |
2188 |
3021 |
3568 |
3599 |
3589 |
3646 |
3945 |
4375 |
4172 |
4360 |
4494 |
|
Other Gases |
All Consumers |
Mtherms |
7009 |
1126 |
1371 |
1317 |
1246 |
1224 |
1251 |
1268 |
1339 |
1394 |
1397 |
1417 |
Figure 2.4 Generating Mix (1980-1999) Million Tonnes Oil Equivalent (Mtoe).
The effect of these changes in the power sector are clearly reflected in the carbon dioxide emissions. Since 1970 electricity generation has increased by 45% but emissions have decreased by around 32%. More significantly, emissions have fallen by 29% between 1990 and 1999. This is due specifically to:
The overall effect of the fuel and technology changes are also clearly illustrated in Figure 2.5 which shows that the average CO2 emission (from power generation) per kWh electricity generated decreases from 245 tonnes/GWh in 1970 to 114 tonnes/GWh in 1999. This trend is likely to continue into the future through the use of more advanced technology and abatement equipment. However, the extent to which nuclear power is used in the future is expected to have a large impact on air emissions. A decreased use of nuclear power for electricity production is expected to give rise to increased consumption of fossil fuels.
Figure 2.5 Average CO2 Emission per unit of Electricity Generated (ktonne/GWh)
The domestic use of coal (including anthracite) shows an overall decline between 1970 and 1999, falling by 87%; domestic use of smokeless solid fuels (including coke) has also fallen significantly. This reflects a trend away from solid fuels towards alternatives such as electricity and gas in the domestic sector. Over the same period the domestic use of natural gas has increased by a factor of over 19.
The 1999 industrial emissions show a decrease of 45% since 1970. The curve exhibits peaks in 1973, 1979, and 1988 which are due in part to the cold winters in these years but mainly to the various levels of economic activity. According to DTI (2001), industrial energy consumption in 1999 has declined since 1970 by 43% reflecting the decline in a number of the energy intensive industries conducted in the UK and improvements in energy efficiency. Over this period, there has also been a marked move away from coal and oil consumption to gas and to a lesser extent electricity.
Total emissions from the transport sector have steadily increased since 1970. Of these, road transport emissions have risen by 92% and currently account for 88% of the total transport/mobile machinery emissions in 1999. This also equates to 22% of the total UK carbon dioxide emissions. Emissions fell a little during 1974-75 reflecting the increase in motor fuel prices after the oil crisis. The steady increase in fuel use by most forms of transport reflects the increased demand for transport in the UK between 1970 and 1999. The increased use of private motor vehicles has resulted in a 51% increase in the consumption of petrol from 1970 to 1999. However, petrol consumption has declined by 11% since 1990, which is a result of the increase in popularity of diesel cars, and the increased fuel efficiency of petrol driven cars. Increased use of goods vehicles is reflected in the increase in DERV consumption by a factor of 3 since 1970.
Agriculture/forests/land use change
The effect of changing land-use can result in either net emission or net absorption of CO2 , particularly on a global scale. For example, forest clearing for agricultural use could be a net source of CO2. Recently the Intergovernmental Panel on Climate Change agreed new guidelines for preparing national inventories (IPCC, 1997). Land use change and forestry estimates are included in the UK Greenhouse Gas Inventory (Salway et al, 2001) for the years 1990-99. The estimates have yet to be included in the NAEI which covers the longer period 1970-1999. For comparative purposes the land use change estimates of carbon emissions and removals are summarised in Table 2.4 (Milne, 2000). The new guidelines for Land Use Change and Forestry include emissions from liming of soils under ‘D CO2 Emissions and Removals from Soils’. These are already included in the NAEI under Agricultural Soils.
Table 2.4 Emissions and Removals of CO21 from Land Use Change and Forestry in 1999 (kt)
|
Sources |
Emissions |
Removals |
||
|
A. Changes in Forest and Other Woody Biomass Stocks 1 |
- |
10439 |
||
|
B. Forest and Grassland conversion |
- |
- |
||
|
C. Abandonment of Managed Lands |
- |
- |
||
|
D. CO2 Emissions and Removals from Soil 2 |
12663 |
- |
||
|
E. Other 3 |
3608 |
1100 |
||
|
Total |
16271 |
11539 |
||
1 Removals include removals to forest and soil litter, and to forest products.
2 Emissions include removals to soil due to set aside of arable land
3 Emissions include emissions from soil due to upland drainage, lowland drainage and peat extraction. Removals are increases in crop biomass.