Heavy metal emission estimates
The NAEI currently reports emissions of ten heavy metals. These are:
Emissions inventories for all those except selenium and vanadium were reported by Leech (1993), Gillham et al (1994) and Couling et al (1994). Emissions of all ten metals were reported by Salway et al (1996, 1996a, 1997, 1999) and Goodwin et al (1999).
Heavy metal emissions arise from a number of different sources, but in general, fuel combustion and certain industrial processes which produce dust are the main contributors the total emission. The metal emissions arise from the trace concentrations in the fuels or in the case of industrial processes the raw materials. In the case of combustion, the metals are emitted either as vapour or particulate or both. Volatile metals such as mercury and selenium are mostly emitted as vapour. Metals such as cadmium and lead are emitted as both with some of the vapour condensing onto the ash particles. Other metals such as chromium do not vaporise and are emitted in the ash particles.
The inventories are compiled based on the list of source categories given by van der Most (1992) and EMEP/CORINAIR(1996). Most of the emissions are estimated using emission factors applied to fuel consumption statistics (DTI, 1999) and in the case of industrial processes, production statistics.
UK data is used for the metal contents of coal and fuel oils where available. Emissions from the combustion of liquid fuels are based on data reported by Wood (1996) and other sources in the literature (Sullivan, 1992; Lloyds 1995). Lead emissions from petrol combustion are based on detailed data on the lead content of petrol published by the Institute of Petroleum (1999). The emissions from coal and oil fired power stations are based on estimates reported in the Pollution Inventory (Environment Agency, 1999) or the operators’ annual reports. Emissions from other coal combustion sources follow the PARCOM methodology (van der Most, 1992) but use data based on UK coal (Smith, 1987). Many of the emission factors for industrial processes such as iron & steel, primary lead/zinc manufacture, lead-glass and have been based on a study sponsored by DETR which reported emissions based on Environment Agency data (Smyllie, 1996). Emissions from other non-ferrous metal processes, cement production and coke ovens are based on data reported in the Pollution Inventory (Environment Agency, 1999). Emissions from the chloralkali industry are based on manufacturers estimates (Ratcliffe, 1999). Emissions from waste incineration are based on measured data for historic emissions (Clayton et al, 1991) and Environment Agency (1999) data for current estimates. Where UK specific emission factor data were unavailable, other sources of emission factor data were taken from EPEP/CORINAIR(1996), van der Most (1992) and Jockel and Hartje (1991).
Emissions of heavy metals are particularly uncertain owing to the variation in metal content of fuels and raw materials used in industrial processes. Most of these emissions are calculated using emission factors expressed in terms of the mass of metal emitted per unit mass of fuel burnt. For industrial processes the emission factor is in terms of mass of metal emitted per unit mass of product.
Heavy metal emissions can be reduced using gas cleaning equipment which removes particulates from the waste gases. This abatement equipment would be fitted to large coal-fired industrial boilers and power station boilers and also industrial processes which produce large amounts of dust. Hence, when estimating emission factors it is often necessary to assume some efficiency of abatement.
The emission factors used in generating the emission estimates are assumed not to vary with time for many of the sources considered. This is assumed as there is usually insufficient information to estimate any temporal variation of the emission factor. However, for sources such as road transport, chlorine production, waste incineration and public power generation there is sufficient information to allow time dependent emission factors to be estimated.
At the end of 1996 all municipal solid waste and clinical incinerators had to comply with new emission standards (see also Section 6.2). As a result, a number of old incinerators have closed, whilst some have been renovated and some new ones opened. Hence there been significant reductions in emissions from waste incineration. Data is available for most metals for the new plant (Environment Agency, 1999).
The estimates are summarised in Tables 6.11 to 6.20 in the UN/ECE/ CORINAIR SNAP 94 reporting format. This differs from the SNAP 90 system used for previous NAEI annual reports (with the exception of Salway et al 1999 and Goodwin et al 1999). The main differences are that Combustion in Energy Production and Transformation, now includes combustion emissions from electricity generation both from fossil fuels and waste incineration together with refineries and other energy industries. These sources were previously reported under industrial combustion and waste incineration. The waste incineration category now only includes incinerators which do not generate electricity. By 1997 all MSW incinerators in operation generated electricity, hence from 1997 onwards no emissions from MSW incineration are reported under waste. In previous inventories, the emission for road transport was based on total UK petrol and DERV consumption, however in the new inventory it is assumed that a small proportion of fuel is used by off-road sources such as agricultural vehicles and construction equipment. These emissions are reported under Other Transport and Machinery but are only significant for lead. The changes in the classification will have no effect on the total.
It is difficult to estimate the accuracy of the emissions estimates because they are based on a limited set of measurements some of which are derived from foreign sources which may not be applicable to UK conditions. It is thought that the estimates of lead, cadmium and mercury are the most accurate, and the lowest in uncertainty. Emissions of zinc, nickel, copper, chromium and arsenic are considered to be less accurate, whilst emissions of selenium and vanadium are thought to be the least accurate, with the highest uncertainties. Wenborn et al (1998) estimated the uncertainties in heavy metal emissions in 1990 using a Monte Carlo analysis. Based on the minimum-maximum spread the uncertainties were: lead ± 14%; cadmium ± 38% and mercury ± 28%. The uncertainty in the lead emission for more recent years will be greater than this due to the lower contribution from petrol combustion.
Table 6.11 and Figure 6.2 summarise the UK emissions of arsenic. Emissions have declined by 82% since 1970. The largest source of emission arises from coal combustion with other sources being very small by comparison. Coal use has declined over the period considered, in favour of natural gas use. The emissions from the industrial sector are large compared with the emissions from public power generation; this is due to the different levels of abatement efficiency that are assumed. New data from the Pollution Inventory has resulted in an increase in emissions from cement kilns since the last inventory and the inclusion of a new source – copper refining. The large reduction in waste emissions is due to improved controls on MSW incinerators from 1997 onwards and their conversion to power generating plant.
Table 6.11 UK Emissions of Arsenic by UN/ECE Category (tonnes)
|
1970 |
1980 |
1990 |
1991 |
1992 |
1993 |
1994 |
1995 |
1996 |
1997 |
1998 |
1998% |
|
|
BY UN/ECE CATEGORY1 |
||||||||||||
|
Comb. in Energy Prod. |
||||||||||||
|
Public Power |
18.1 |
19.1 |
17.8 |
17.5 |
16.2 |
13.4 |
11.7 |
8.9 |
8.3 |
5.3 |
5.7 |
11% |
|
Public Power (waste) |
0.2 |
0.2 |
0.2 |
0.3 |
0.6 |
0.5 |
0.5 |
0.6 |
0.7 |
1% |
||
|
Petroleum Refining Plants |
0.1 |
0.1 |
0.1 |
0.1 |
0.1 |
0.1 |
0.1 |
0.1 |
0.1 |
0.1 |
0.1 |
0% |
|
Other Comb. & Trans. |
8.9 |
3.1 |
0.5 |
0.5 |
0.4 |
0.2 |
0.1 |
0.0 |
0.0 |
0.0 |
0.0 |
0% |
|
Comb. in Comm./Inst/Res |
||||||||||||
|
Residential Plant |
112.7 |
51.1 |
25.3 |
27.5 |
24.0 |
26.2 |
21.9 |
15.6 |
16.2 |
14.7 |
13.0 |
26% |
|
Comm/Pub/Agri Comb. |
31.0 |
10.9 |
6.6 |
6.1 |
5.0 |
4.4 |
3.4 |
2.4 |
2.7 |
3.0 |
1.8 |
3% |
|
Combustion in Industry |
||||||||||||
|
Iron & Steel Comb. |
4.1 |
1.0 |
0.3 |
0.3 |
0.3 |
0.3 |
0.3 |
0.2 |
0.2 |
0.2 |
0.2 |
0% |
|
Other Ind. Comb. |
91.5 |
37.0 |
35.5 |
37.6 |
41.3 |
38.6 |
35.9 |
33.1 |
28.7 |
26.0 |
23.2 |
46% |
|
Non-Ferrous Metals |
3.5 |
3.8 |
3.7 |
3.2 |
3.4 |
3.6 |
3.5 |
3.2 |
3.5 |
3.9 |
3.5 |
7% |
|
Glass Production |
0.8 |
0.8 |
0.8 |
0.8 |
0.8 |
0.8 |
0.8 |
0.8 |
0.8 |
0.8 |
0.8 |
2% |
|
Production Processes |
||||||||||||
|
Processes in Industry |
0.2 |
0.1 |
0.1 |
0.1 |
0.1 |
0.1 |
0.1 |
0.1 |
0.1 |
0.1 |
0.1 |
0% |
|
Iron & Steel |
2.1 |
1.0 |
1.6 |
1.5 |
1.5 |
1.5 |
1.6 |
1.6 |
1.6 |
1.7 |
1.6 |
3% |
|
Other Trans/Mach |
0.0 |
0.0 |
0.0 |
0.0 |
0.0 |
0.0 |
0.0 |
0.0 |
0.0 |
0.0 |
0.0 |
0% |
|
Waste |
1.1 |
1.1 |
0.9 |
0.9 |
0.9 |
0.8 |
0.6 |
0.5 |
0.5 |
0.0 |
0.0 |
0% |
|
By FUEL TYPE |
||||||||||||
|
Solid |
251.3 |
109.3 |
73.3 |
77.3 |
75.4 |
71.6 |
61.9 |
49.2 |
44.9 |
38.3 |
32.9 |
65% |
|
Petroleum |
3.6 |
1.9 |
1.7 |
1.5 |
1.2 |
1.0 |
0.8 |
0.6 |
0.6 |
0.2 |
0.2 |
0% |
|
Gas |
0.0 |
0.0 |
0.0 |
0.0 |
0.0 |
0.0 |
0.0 |
0.0 |
0.0 |
0.0 |
0.0 |
0% |
|
Non-Fuel |
19.3 |
18.0 |
18.4 |
17.5 |
17.5 |
17.7 |
17.8 |
17.4 |
17.7 |
17.8 |
17.5 |
35% |
|
TOTAL |
274.1 |
129.2 |
93.4 |
96.3 |
94.1 |
90.3 |
80.4 |
67.2 |
63.2 |
56.3 |
50.6 |
100% |
1 See Appendix 4 for definition of UN/ECE Categories
Figure 6.2 UK Emissions of Arsenic
Table 6.12 and Figure 6.3 summarise the UK emissions of cadmium. Emissions have declined by 59% since 1970. The main sources are non-ferrous metal production and iron and steel manufacture. The former includes a lead-zinc smelting plant and a number of lead battery recycling plants. The estimate for energy production includes a significant proportion from waste combustion and fuel oil combustion for electricity generation. The decline in emissions is a result of the general fall in coal combustion and the decline in fuel oil combustion in power generation. The large reduction in waste emissions is due to improved controls on MSW incinerators from 1997 onwards and their conversion to power generating plant. The main changes in the inventory are a reduction in coke oven emissions in ‘processes in industry’ and a new source in ‘other industrial combustion’ – copper refining.
Table 6.12 UK Emissions of Cadmium by UN/ECE Category (tonnes)
|
1970 |
1980 |
1990 |
1991 |
1992 |
1993 |
1994 |
1995 |
1996 |
1997 |
1998 |
1998% |
|
|
BY UN/ECE CATEGORY1 |
||||||||||||
|
Comb. in Energy Prod. |
||||||||||||
|
Public Power |
4.0 |
3.1 |
2.9 |
2.8 |
2.4 |
2.0 |
1.6 |
1.2 |
1.2 |
0.6 |
0.6 |
5% |
|
Public Power (waste) |
1.2 |
1.3 |
1.5 |
2.1 |
3.5 |
0.4 |
0.2 |
0.1 |
0.1 |
1% |
||
|
Petroleum Refining Plants |
0.0 |
0.0 |
0.0 |
0.0 |
0.0 |
0.0 |
0.0 |
0.0 |
0.0 |
0.0 |
0.0 |
0% |
|
Other Comb. & Trans. |
0.2 |
0.1 |
0.0 |
0.0 |
0.0 |
0.0 |
0.0 |
0.0 |
0.0 |
0.0 |
0.0 |
0% |
|
Comb. in Comm/Inst/Res |
||||||||||||
|
Residential Plant |
2.7 |
1.3 |
0.7 |
0.7 |
0.7 |
0.7 |
0.6 |
0.5 |
0.5 |
0.5 |
0.4 |
3% |
|
Comm/Pub/Agri Comb. |
0.8 |
0.3 |
0.2 |
0.2 |
0.1 |
0.1 |
0.1 |
0.1 |
0.1 |
0.1 |
0.1 |
0% |
|
Combustion in Industry |
||||||||||||
|
Iron & Steel Comb. |
1.8 |
0.8 |
0.8 |
0.7 |
0.8 |
0.8 |
0.7 |
0.6 |
0.5 |
0.4 |
0.4 |
3% |
|
Other Ind. Comb. |
2.4 |
1.1 |
1.0 |
1.0 |
1.1 |
1.0 |
1.0 |
0.9 |
0.8 |
0.7 |
0.6 |
5% |
|
Non-Ferrous Metals |
6.4 |
5.6 |
6.9 |
6.9 |
8.1 |
8.6 |
7.9 |
6.4 |
7.4 |
8.7 |
7.6 |
58% |
|
Glass Production |
0.3 |
0.4 |
0.4 |
0.4 |
0.4 |
0.4 |
0.4 |
0.4 |
0.4 |
0.4 |
0.4 |
3% |
|
Production Processes |
||||||||||||
|
Processes in Industry |
0.7 |
0.6 |
0.5 |
0.4 |
0.4 |
0.4 |
0.4 |
0.4 |
0.4 |
0.4 |
0.4 |
3% |
|
Iron & Steel |
2.6 |
2.0 |
2.3 |
1.9 |
1.9 |
1.8 |
1.7 |
1.6 |
1.6 |
1.6 |
1.5 |
11% |
|
Non-Ferrous Metals |
0.0 |
0.0 |
0.0 |
0.0 |
0.0 |
0.0 |
0.0 |
0.0 |
0.0 |
0.0 |
0.0 |
0% |
|
Road Transport |
||||||||||||
|
Combustion |
0.2 |
0.2 |
0.3 |
0.3 |
0.4 |
0.4 |
0.4 |
0.4 |
0.4 |
0.4 |
0.4 |
3% |
|
Brake & Tyre Wear |
0.0 |
0.1 |
0.1 |
0.1 |
0.1 |
0.1 |
0.1 |
0.1 |
0.1 |
0.1 |
0.1 |
1% |
|
Other Trans/Mach |
0.1 |
0.0 |
0.0 |
0.0 |
0.0 |
0.0 |
0.0 |
0.0 |
0.0 |
0.0 |
0.0 |
0% |
|
Waste |
9.4 |
9.4 |
8.2 |
8.2 |
7.9 |
7.4 |
6.0 |
2.7 |
1.5 |
0.5 |
0.5 |
4% |
|
By FUEL TYPE |
||||||||||||
|
Solid |
7.3 |
4.1 |
3.1 |
3.2 |
3.1 |
2.8 |
2.4 |
1.9 |
1.7 |
1.4 |
1.3 |
10% |
|
Petroleum |
3.0 |
1.8 |
1.8 |
1.6 |
1.4 |
1.2 |
1.0 |
0.8 |
0.9 |
0.6 |
0.6 |
4% |
|
Gas |
0.0 |
0.0 |
0.0 |
0.0 |
0.0 |
0.0 |
0.0 |
0.0 |
0.0 |
0.0 |
0.0 |
0% |
|
Non-Fuel |
21.4 |
19.1 |
20.8 |
20.3 |
21.4 |
21.8 |
21.0 |
12.9 |
12.4 |
12.5 |
11.1 |
86% |
|
TOTAL |
31.6 |
25.1 |
25.7 |
25.1 |
25.8 |
25.7 |
24.4 |
15.7 |
15.0 |
14.5 |
13.0 |
100% |
1 See Appendix 4 for definition of UN/ECE Categories
Figure 6.3 UK Emissions of Cadmium
Table 6.13 and Figure 6.4 summarise the UK emissions of chromium. Emissions have declined by 71% since 1970. The largest sources are various forms of coal combustion and iron and steel production processes. There have been significant revisions based on data from the Pollution Inventory. In particular a large source pertaining to nickel - chromium use has been added under ‘iron & steel processes’ as well as a significant increase in coke oven emissions under ‘processes in industry’. Industrial combustion has been revised downwards due to new cement kiln data. Glass production now includes flat glass as well as container glass.
Table 6.13 UK Emissions of Chromium by UN/ECE Category (tonnes)
|
1970 |
1980 |
1990 |
1991 |
1992 |
1993 |
1994 |
1995 |
1996 |
1997 |
1998 |
1998% |
|
|
BY UN/ECE CATEGORY1 |
||||||||||||
|
Comb. in Energy Prod. |
||||||||||||
|
Public Power |
50.6 |
57.5 |
53.0 |
52.6 |
49.4 |
41.1 |
36.3 |
27.6 |
25.4 |
17.0 |
16.8 |
27% |
|
Public Power (waste) |
2.3 |
2.3 |
2.8 |
3.8 |
6.3 |
4.5 |
2.5 |
0.3 |
0.3 |
0% |
||
|
Petroleum Refining Plants |
1.6 |
1.5 |
0.8 |
0.9 |
1.0 |
1.0 |
1.0 |
1.0 |
1.0 |
1.0 |
1.0 |
2% |
|
Other Comb. & Trans. |
3.1 |
1.1 |
0.2 |
0.2 |
0.1 |
0.1 |
0.0 |
0.0 |
0.0 |
0.0 |
0.0 |
0% |
|
Comb. in Comm/Inst/Res |
||||||||||||
|
Residential Plant |
39.1 |
17.7 |
8.8 |
9.5 |
8.3 |
9.1 |
7.6 |
5.4 |
5.6 |
5.1 |
4.5 |
7% |
|
Comm/Pub/Agri Comb. |
12.5 |
4.6 |
2.7 |
2.5 |
2.2 |
2.0 |
1.6 |
1.2 |
1.3 |
1.3 |
0.8 |
1% |
|
Combustion in Industry |
||||||||||||
|
Iron & Steel Comb. |
4.6 |
1.6 |
1.7 |
1.6 |
1.6 |
1.6 |
1.6 |
1.5 |
1.4 |
1.3 |
1.3 |
2% |
|
Other Ind. Comb. |
35.2 |
13.6 |
9.5 |
10.2 |
11.5 |
10.0 |
9.2 |
7.9 |
6.4 |
5.1 |
4.0 |
7% |
|
Glass Production |
6.0 |
7.0 |
7.2 |
7.1 |
6.9 |
6.7 |
6.7 |
6.7 |
7.1 |
7.1 |
7.0 |
11% |
|
Production Processes |
||||||||||||
|
Processes in Industry |
7.4 |
3.6 |
3.1 |
2.9 |
2.6 |
2.5 |
2.5 |
2.5 |
2.5 |
2.5 |
2.4 |
4% |
|
Iron & Steel |
37.6 |
30.4 |
32.2 |
26.6 |
27.0 |
27.3 |
26.9 |
26.9 |
25.4 |
27.0 |
23.5 |
38% |
|
Road Transport |
0.2 |
0.2 |
0.3 |
0.3 |
0.4 |
0.4 |
0.4 |
0.4 |
0.4 |
0.4 |
0.4 |
1% |
|
Other Trans/Mach |
0.2 |
0.1 |
0.1 |
0.1 |
0.1 |
0.1 |
0.1 |
0.1 |
0.1 |
0.1 |
0.1 |
0% |
|
Waste |
13.1 |
13.1 |
10.8 |
10.8 |
10.3 |
9.3 |
6.9 |
4.5 |
2.3 |
0.0 |
0.0 |
0% |
|
By FUEL TYPE |
||||||||||||
|
Solid |
138.4 |
92.1 |
73.7 |
74.5 |
70.8 |
61.5 |
54.3 |
42.3 |
39.0 |
29.2 |
27.0 |
43% |
|
Petroleum |
12.0 |
7.2 |
3.9 |
4.1 |
4.1 |
4.1 |
3.8 |
3.2 |
3.0 |
2.4 |
2.2 |
4% |
|
Gas |
0.0 |
0.0 |
0.0 |
0.0 |
0.0 |
0.0 |
0.0 |
0.0 |
0.0 |
0.0 |
0.0 |
0% |
|
Non-Fuel |
60.9 |
52.7 |
55.2 |
49.2 |
49.3 |
49.4 |
49.1 |
44.7 |
39.4 |
36.5 |
32.9 |
53% |
|
TOTAL |
211.3 |
152.0 |
132.8 |
127.8 |
124.2 |
114.9 |
107.3 |
90.3 |
81.4 |
68.1 |
62.1 |
100% |
1 See Appendix 4 for definition of UN/ECE Categories
Figure 6.4 UK Emissions of Chromium
Table 6.14 and Figure 6.5 summarise the UK emissions of copper. Emissions have declined by 74% since 1970. The main sources are coal combustion, iron and steel manufacture and non-ferrous metals production. Emissions have declined over the period due to the decline in coal combustion and to a lesser extent the combustion of heavy fuel oil. The large reduction in waste emissions is due to improved controls on MSW waste incinerators from 1997 and their conversion to power generating plant. However new emission data reported in the Pollution Inventory has led to emissions being revised downwards for recent years. The main changes in the inventory are a small reduction in coke oven emissions in ‘processes in industry’ and a new large source in ‘other industrial combustion’ – copper refining. In addition, emissions from cement kilns have been estimated for the first time
Table 6.14 UK Emissions of Copper by UN/ECE Category (tonnes)
|
1970 |
1980 |
1990 |
1991 |
1992 |
1993 |
1994 |
1995 |
1996 |
1997 |
1998 |
1998% |
|
|
BY UN/ECE CATEGORY1 |
||||||||||||
|
Comb. in Energy Prod. |
||||||||||||
|
Public Power |
39.5 |
44.5 |
41.1 |
40.7 |
38.1 |
31.7 |
28.0 |
21.3 |
19.6 |
13.1 |
15.7 |
27% |
|
Public Power (waste) |
3.1 |
3.1 |
3.8 |
5.3 |
8.7 |
6.2 |
3.5 |
0.6 |
0.7 |
1% |
||
|
Petroleum Refining Plants |
2.4 |
2.3 |
1.3 |
1.4 |
1.4 |
1.5 |
1.6 |
1.4 |
1.4 |
1.4 |
1.5 |
2% |
|
Other Comb. & Trans. |
4.0 |
1.4 |
0.2 |
0.2 |
0.2 |
0.1 |
0.0 |
0.0 |
0.0 |
0.0 |
0.0 |
0% |
|
Comb. in Comm/Inst/Res |
||||||||||||
|
Residential Plant |
50.7 |
23.1 |
11.5 |
12.5 |
10.9 |
11.9 |
10.0 |
7.2 |
7.4 |
6.8 |
6.0 |
10% |
|
Comm/Pub/Agri Comb. |
16.8 |
6.2 |
3.5 |
3.3 |
2.9 |
2.7 |
2.2 |
1.7 |
1.8 |
1.8 |
1.1 |
2% |
|
Combustion in Industry |
||||||||||||
|
Iron & Steel Comb. |
10.5 |
3.7 |
5.3 |
5.1 |
5.0 |
5.0 |
5.1 |
5.2 |
5.4 |
5.5 |
5.3 |
9% |
|
Other Ind. Comb. |
45.9 |
17.5 |
13.8 |
15.0 |
16.7 |
15.4 |
13.9 |
12.0 |
9.8 |
8.2 |
6.9 |
12% |
|
Non-Ferrous Metals |
22.4 |
24.9 |
19.5 |
12.0 |
8.3 |
9.0 |
8.9 |
9.3 |
10.2 |
11.1 |
9.9 |
17% |
|
Glass Production |
1.5 |
1.7 |
1.8 |
1.8 |
1.7 |
1.7 |
1.7 |
1.7 |
1.8 |
1.8 |
1.7 |
3% |
|
Production Processes |
||||||||||||
|
Processes in Industry |
1.4 |
0.7 |
0.6 |
0.5 |
0.5 |
0.5 |
0.5 |
0.4 |
0.4 |
0.4 |
0.4 |
1% |
|
Iron & Steel |
13.3 |
7.6 |
10.8 |
9.5 |
9.1 |
8.8 |
8.6 |
8.4 |
8.6 |
8.8 |
8.4 |
14% |
|
Road Transport |
0.3 |
0.4 |
0.6 |
0.6 |
0.6 |
0.6 |
0.6 |
0.6 |
0.6 |
0.6 |
0.6 |
1% |
|
Other Trans/Mach |
0.3 |
0.1 |
0.1 |
0.1 |
0.1 |
0.2 |
0.2 |
0.2 |
0.2 |
0.1 |
0.1 |
0% |
|
Waste |
19.7 |
19.7 |
16.7 |
16.6 |
15.9 |
14.5 |
11.2 |
8.0 |
4.3 |
0.4 |
0.4 |
1% |
|
By FUEL TYPE |
||||||||||||
|
Solid |
144.9 |
85.4 |
66.3 |
67.9 |
65.0 |
58.1 |
50.8 |
39.7 |
36.4 |
28.3 |
28.3 |
48% |
|
Petroleum |
18.0 |
10.7 |
5.8 |
6.1 |
6.1 |
6.0 |
5.7 |
4.8 |
4.5 |
3.7 |
3.5 |
6% |
|
Gas |
0.0 |
0.0 |
0.0 |
0.0 |
0.0 |
0.0 |
0.0 |
0.0 |
0.0 |
0.0 |
0.0 |
0% |
|
Non-Fuel |
65.9 |
57.8 |
57.7 |
48.6 |
44.3 |
44.7 |
44.6 |
39.2 |
34.2 |
28.7 |
27.0 |
46% |
|
TOTAL |
228.8 |
153.9 |
129.8 |
122.6 |
115.3 |
108.8 |
101.1 |
83.6 |
75.0 |
60.6 |
58.8 |
100% |
1 See Appendix 4 for definition of UN/ECE Categories
Figure 6.5 UK Emissions of Copper
Table 6.15 and Figure 6.6 summarise the UK emissions of lead. Emissions have declined by 86% since 1970. The largest source is still from anti-knock lead additives in petrol and it is here where the most significant reductions have been made. The lead content of leaded petrol was reduced from around 0.34 g/l to 0.143 g/l in 1986 and since 1987 sales of unleaded petrol have increased particularly as a result of the increased use of cars fitted with catalytic converters. Other major sources are non-ferrous metal production and industrial processes. There has been some reduction in emissions from iron and steel production processes due to improved abatement measures. Emissions have also declined as a result of the decreasing use of coal. The large reduction in waste emissions is due to improved controls on MSW incinerators from 1997 onwards and their conversion to power generating plant. There are only relatively minor changes since the last inventory. These are an increase in coke oven emissions in ‘processes in industry’ and a new source in ‘other industrial combustion’ – copper refining. In addition emissions from cement kilns have been revised downwards
Table 6.15 UK Emissions of Lead by UN/ECE Category (tonnes)
|
1970 |
1980 |
1990 |
1991 |
1992 |
1993 |
1994 |
1995 |
1996 |
1997 |
1998 |
1998% |
|
|
BY UN/ECE CATEGORY1 |
||||||||||||
|
Comb. in Energy Prod. |
||||||||||||
|
Public Power |
81 |
88 |
82 |
77 |
69 |
48 |
43 |
39 |
38 |
25 |
26 |
3% |
|
Public Power (waste) |
23 |
23 |
28 |
39 |
62 |
43 |
23 |
0 |
0 |
0% |
||
|
Petroleum Refining Plants |
3 |
3 |
2 |
2 |
2 |
2 |
2 |
2 |
2 |
2 |
2 |
0% |
|
Other Comb. & Trans. |
13 |
4 |
1 |
1 |
1 |
0 |
0 |
0 |
0 |
0 |
0 |
0% |
|
Comb. in Comm/Inst/Res |
211 |
91 |
47 |
49 |
43 |
45 |
38 |
27 |
28 |
26 |
22 |
2% |
|
Combustion in Industry |
||||||||||||
|
Iron & Steel Comb. |
30 |
11 |
14 |
13 |
13 |
13 |
13 |
12 |
12 |
11 |
10 |
1% |
|
Other Ind. Comb. |
137 |
53 |
46 |
48 |
53 |
49 |
46 |
41 |
33 |
28 |
23 |
2% |
|
Non-Ferrous Metals |
213 |
215 |
213 |
189 |
201 |
212 |
202 |
181 |
197 |
216 |
189 |
18% |
|
Glass Production |
14 |
15 |
15 |
15 |
15 |
15 |
15 |
15 |
14 |
14 |
13 |
1% |
|
Production Processes |
||||||||||||
|
Processes in Industry |
104 |
97 |
96 |
96 |
96 |
95 |
95 |
82 |
72 |
113 |
89 |
9% |
|
Iron & Steel |
119 |
98 |
106 |
84 |
81 |
77 |
71 |
66 |
62 |
65 |
57 |
6% |
|
Non-Ferrous Metals |
4 |
3 |
1 |
1 |
1 |
1 |
2 |
2 |
2 |
2 |
2 |
0% |
|
Road Transport |
6384 |
7463 |
2177 |
1940 |
1729 |
1527 |
1298 |
1067 |
910 |
800 |
592 |
57% |
|
Other Trans/Mach |
98 |
75 |
15 |
14 |
13 |
11 |
10 |
8 |
7 |
6 |
5 |
0% |
|
Waste |
149 |
149 |
126 |
126 |
121 |
110 |
87 |
63 |
33 |
3 |
3 |
0% |
|
By FUEL TYPE |
||||||||||||
|
Solid |
423 |
221 |
164 |
166 |
157 |
135 |
118 |
100 |
95 |
77 |
69 |
7% |
|
Petroleum |
6514 |
7556 |
2203 |
1965 |
1752 |
1548 |
1316 |
1082 |
924 |
811 |
601 |
58% |
|
Gas |
0 |
0 |
0 |
0 |
0 |
0 |
0 |
0 |
0 |
0 |
0 |
0% |
|
Non-Fuel |
624 |
588 |
597 |
548 |
556 |
563 |
549 |
465 |
415 |
423 |
362 |
35% |
|
TOTAL |
7561 |
8365 |
2964 |
2679 |
2465 |
2245 |
1983 |
1648 |
1434 |
1311 |
1033 |
100% |
1 See Appendix 4 for definition of UN/ECE Categories
Figure 6.6 UK Emissions of Lead
Table 6.16 and Figure 6.7 summarise the UK emissions of mercury. Emissions have declined by 74% since 1970. The main sources are waste incineration, the manufacture of chlorine in mercury cells, non-ferrous metal production and coal combustion. Emissions have declined as a result of improved controls on mercury cells and their replacement by diaphragm or membrane cells and the decline of coal use. The large reduction in waste emissions is due to improved controls on MSW incinerators from 1997 onwards and their conversion to power generating plant. There are only relatively minor changes sine the last inventory. These are an increase in cement kiln emissions in ‘industrial combustion’ and a small revision upwards in MSW incineration emissions.
Table 6.16 UK Emissions of Mercury by UN/ECE Category (tonnes)
|
1970 |
1980 |
1990 |
1991 |
1992 |
1993 |
1994 |
1995 |
1996 |
1997 |
1998 |
1998% |
|
|
BY UN/ECE CATEGORY1 |
||||||||||||
|
Comb. in Energy Prod. |
||||||||||||
|
Public Power |
7.5 |
8.1 |
7.5 |
7.4 |
6.9 |
4.7 |
4.4 |
4.1 |
2.5 |
1.6 |
2.3 |
19% |
|
Public Power (waste) |
0.9 |
0.9 |
1.1 |
1.5 |
2.4 |
0.2 |
0.3 |
1.0 |
0.3 |
3% |
||
|
Petroleum Refining Plants |
0.1 |
0.1 |
0.0 |
0.0 |
0.0 |
0.0 |
0.0 |
0.0 |
0.0 |
0.0 |
0.0 |
0% |
|
Other Comb. & Trans. |
0.5 |
0.2 |
0.0 |
0.0 |
0.0 |
0.0 |
0.0 |
0.0 |
0.0 |
0.0 |
0.0 |
0% |
|
Comb. in Comm/Inst/Res |
||||||||||||
|
Residential Plant |
6.6 |
3.0 |
1.5 |
1.7 |
1.5 |
1.6 |
1.3 |
1.0 |
1.0 |
0.9 |
0.8 |
7% |
|
Comm/Pub/Agri Comb. |
1.8 |
0.6 |
0.4 |
0.3 |
0.3 |
0.3 |
0.2 |
0.1 |
0.2 |
0.2 |
0.1 |
1% |
|
Combustion in Industry |
||||||||||||
|
Iron & Steel Comb. |
0.9 |
0.4 |
0.3 |
0.3 |
0.3 |
0.3 |
0.3 |
0.3 |
0.3 |
0.3 |
0.3 |
2% |
|
Other Ind. Comb. |
5.3 |
2.1 |
2.0 |
2.1 |
2.3 |
2.1 |
2.0 |
1.9 |
1.6 |
1.5 |
1.3 |
11% |
|
Non-Ferrous Metals |
2.1 |
1.7 |
2.4 |
2.5 |
3.0 |
3.2 |
2.9 |
2.3 |
2.7 |
3.2 |
2.8 |
23% |
|
Glass Production |
0.1 |
0.1 |
0.2 |
0.1 |
0.1 |
0.1 |
0.1 |
0.1 |
0.1 |
0.1 |
0.1 |
1% |
|
Production Processes |
||||||||||||
|
Processes in Industry |
13.5 |
12.2 |
8.0 |
8.8 |
7.3 |
3.2 |
3.5 |
4.1 |
2.3 |
1.0 |
1.3 |
10% |
|
Iron & Steel |
1.0 |
0.7 |
0.8 |
0.7 |
0.7 |
0.7 |
0.8 |
0.8 |
0.7 |
0.8 |
0.7 |
6% |
|
Road Transport |
0.0 |
0.0 |
0.0 |
0.0 |
0.0 |
0.0 |
0.0 |
0.0 |
0.0 |
0.0 |
0.0 |
0% |
|
Other Trans/Mach |
0.0 |
0.0 |
0.0 |
0.0 |
0.0 |
0.0 |
0.0 |
0.0 |
0.0 |
0.0 |
0.0 |
0% |
|
Waste |
||||||||||||
|
Landfill |
0.6 |
0.6 |
0.6 |
0.6 |
0.5 |
0.5 |
0.4 |
0.4 |
0.4 |
0.4 |
0.4 |
3% |
|
Waste Incineration |
7.3 |
7.6 |
6.7 |
6.7 |
6.5 |
6.2 |
5.2 |
2.8 |
2.4 |
1.8 |
1.8 |
14% |
|
By FUEL TYPE |
||||||||||||
|
Solid |
20.0 |
12.9 |
10.4 |
10.6 |
10.1 |
8.0 |
7.2 |
6.3 |
4.6 |
3.6 |
4.0 |
32% |
|
Petroleum |
1.2 |
0.7 |
0.5 |
0.5 |
0.4 |
0.3 |
0.3 |
0.3 |
0.2 |
0.1 |
0.1 |
1% |
|
Gas |
0.0 |
0.0 |
0.0 |
0.0 |
0.0 |
0.0 |
0.0 |
0.0 |
0.0 |
0.0 |
0.0 |
0% |
|
Non-Fuel |
25.9 |
23.8 |
20.4 |
21.1 |
20.1 |
16.2 |
16.2 |
11.6 |
9.8 |
9.2 |
8.3 |
67% |
|
TOTAL |
47.2 |
37.4 |
31.4 |
32.2 |
30.6 |
24.5 |
23.6 |
18.2 |
14.6 |
12.9 |
12.4 |
100% |
1 See Appendix 4 for definition of UN/ECE Categories
Figure 6.7 UK Emissions of Mercury
Table 6.17 and Figure 6.8 summarise the UK emissions of nickel. Emissions have declined by 83% since 1970. The main sources of nickel emissions are the combustion of coal and heavy fuel oil. These have declined in use since 1970 in favour of natural gas and are largely responsible for the reduction in total emissions. Since 1989 heavy fuel oil has been replaced by Orimulsion (an emulsion of bitumen in water) in some power stations though this has now been discontinued. The nickel content of Orimulsion was higher than that of heavy fuel oil and resulted in higher emissions in spite of the flue gas cleaning equipment required on these power stations. Emissions from refineries are important because of the large amount of refinery fuel oil and residues burnt. There have been significant revisions based on data from the Pollution Inventory. In particular, a large source pertaining to nickel chromium use has been added under ‘iron & steel processes’ as well as a significant increase in coke oven emissions under ‘processes in industry’. Industrial combustion has been revised upwards due to new cement kiln data. Glass production now includes flat glass as well as container
Table 6.17 UK Emissions of Nickel by UN/ECE Category (tonnes)
|
1970 |
1980 |
1990 |
1991 |
1992 |
1993 |
1994 |
1995 |
1996 |
1997 |
1998 |
1998% |
|
|
BY UN/ECE CATEGORY1 |
||||||||||||
|
Comb. in Energy Prod. |
||||||||||||
|
Public Power |
143.5 |
95.5 |
95.7 |
92.4 |
92.6 |
81.4 |
68.2 |
57.8 |
52.4 |
16.9 |
15.4 |
7% |
|
Public Power (waste) |
1.4 |
1.4 |
1.7 |
2.3 |
3.8 |
2.7 |
1.6 |
0.3 |
0.3 |
0% |
||
|
Petroleum Refining Plants |
142.4 |
134.7 |
74.3 |
82.1 |
84.4 |
87.5 |
90.5 |
84.4 |
84.1 |
84.2 |
85.5 |
36% |
|
Other Comb. & Trans. |
12.1 |
4.2 |
0.7 |
0.7 |
0.5 |
0.3 |
0.1 |
0.1 |
0.1 |
0.1 |
0.1 |
0% |
|
Comb in Comm/Inst/Res |
||||||||||||
|
Residential Plant |
159.0 |
71.4 |
34.9 |
37.8 |
33.1 |
36.0 |
30.2 |
21.9 |
22.2 |
20.2 |
17.7 |
8% |
|
Comm/Pub/Agri Comb. |
199.4 |
86.6 |
43.4 |
43.1 |
44.5 |
45.7 |
45.0 |
37.4 |
35.0 |
26.6 |
20.4 |
9% |
|
Combustion in Industry |
||||||||||||
|
Iron & Steel Comb. |
44.5 |
11.3 |
6.3 |
6.4 |
6.2 |
7.4 |
7.2 |
7.1 |
6.1 |
5.9 |
4.4 |
2% |
|
Other Ind. Comb. |
666.2 |
351.4 |
163.9 |
182.0 |
186.1 |
176.6 |
159.0 |
118.3 |
97.8 |
71.9 |
61.3 |
26% |
|
Non-Ferrous Metals |
0.5 |
0.6 |
0.4 |
0.2 |
0.1 |
0.2 |
0.2 |
0.2 |
0.2 |
0.2 |
0.2 |
0% |
|
Glass Production |
4.8 |
5.5 |
5.7 |
5.6 |
5.5 |
5.3 |
5.3 |
5.3 |
5.6 |
5.6 |
5.5 |
2% |
|
Production Processes |
26.5 |
22.9 |
23.2 |
20.2 |
19.9 |
20.1 |
20.0 |
20.3 |
19.5 |
20.5 |
18.5 |
8% |
|
Road Transport |
0.7 |
0.9 |
1.2 |
1.2 |
1.2 |
1.3 |
1.3 |
1.3 |
1.3 |
1.3 |
1.3 |
1% |
|
Other Trans/Mach |
13.2 |
2.9 |
2.9 |
4.2 |
4.4 |
5.5 |
6.7 |
7.5 |
6.0 |
4.5 |
3.8 |
2% |
|
Waste |
7.9 |
7.9 |
6.5 |
6.5 |
6.2 |
5.5 |
4.1 |
2.7 |
1.4 |
0.0 |
0.0 |
0% |
|
By FUEL TYPE |
||||||||||||
|
Solid |
355.1 |
161.8 |
111.9 |
117.1 |
113.8 |
106.9 |
92.7 |
73.7 |
67.4 |
56.9 |
52.5 |
22% |
|
Petroleum |
1025.0 |
596.2 |
309.7 |
331.3 |
337.8 |
333.2 |
313.7 |
260.3 |
235.8 |
172.9 |
155.6 |
66% |
|
Gas |
0.0 |
0.0 |
0.0 |
0.0 |
0.0 |
0.0 |
0.0 |
0.0 |
0.0 |
0.0 |
0.0 |
0% |
|
Non-Fuel |
40.5 |
37.6 |
39.0 |
35.5 |
34.9 |
35.1 |
35.2 |
32.9 |
30.0 |
28.4 |
26.4 |
11% |
|
TOTAL |
1420.6 |
795.6 |
460.6 |
483.9 |
486.5 |
475.1 |
441.6 |
367.0 |
333.3 |
258.1 |
234.5 |
100% |
1 See Appendix 4 for definition of UN/ECE Categories
Figure 6.8 UK Emissions of Nickel
Table 6.18 and Figure 6.9 summarise the UK emissions of selenium. Emissions have declined by 53% since 1970. The main source of selenium emissions is coal combustion in early years. Only trace amounts are emitted by the combustion of petroleum based fuels. Emissions have reduced over the period considered because of the decline in coal use in favour of natural gas combustion. Consequently glass production is now the dominant source. The estimate for glass manufacture is uncertain because it is based on very limited data. Emissions from glass production have been revised upwards a little due to the inclusion of flat glass production as well as container glass.
Table 6.18 UK Emissions of Selenium by UN/ECE Category (tonnes)
|
1970 |
1980 |
1990 |
1991 |
1992 |
1993 |
1994 |
1995 |
1996 |
1997 |
1998 |
1998% |
|
|
BY UN/ECE CATEGORY |
||||||||||||
|
Comb. in Energy Prod. |
||||||||||||
|
Public Power |
53.4 |
59.9 |
55.3 |
54.8 |
51.2 |
42.6 |
37.6 |
28.5 |
26.3 |
17.5 |
22.0 |
26% |
|
Public Power (waste) |
0.0 |
0.0 |
0.0 |
0.0 |
0.2 |
0.2 |
0.2 |
0.1 |
0.0 |
0% |
||
|
Petroleum Refining Plants |
2.0 |
1.9 |
1.1 |
1.2 |
1.2 |
1.3 |
1.3 |
1.2 |
1.2 |
1.2 |
1.2 |
1% |
|
Other Comb. & Trans. |
2.5 |
0.9 |
0.2 |
0.1 |
0.1 |
0.1 |
0.0 |
0.0 |
0.0 |
0.0 |
0.0 |
0% |
|
Comb. in Comm/Inst/Res |
||||||||||||
|
Residential Plant |
32.7 |
14.8 |
7.3 |
7.9 |
7.0 |
7.6 |
6.3 |
4.5 |
4.7 |
4.3 |
3.8 |
4% |
|
Comm/Pub/Agri Comb. |
11.0 |
4.1 |
2.3 |
2.2 |
2.0 |
1.8 |
1.5 |
1.2 |
1.2 |
1.2 |
0.8 |
1% |
|
Combustion in Industry |
||||||||||||
|
Iron & Steel Comb. |
2.0 |
0.5 |
0.4 |
0.4 |
0.4 |
0.4 |
0.4 |
0.4 |
0.4 |
0.4 |
0.4 |
0% |
|
Other Ind. Comb. |
31.1 |
12.2 |
9.3 |
10.2 |
11.2 |
10.4 |
9.4 |
8.1 |
6.6 |
5.5 |
4.6 |
5% |
|
Glass Production |
45.2 |
52.2 |
54.4 |
53.5 |
52.0 |
50.6 |
50.5 |
50.3 |
53.4 |
52.9 |
52.2 |
61% |
|
Production Processes |
0.5 |
0.3 |
0.4 |
0.4 |
0.4 |
0.4 |
0.4 |
0.4 |
0.4 |
0.4 |
0.4 |
0% |
|
Road Transport |
0.2 |
0.2 |
0.3 |
0.3 |
0.4 |
0.4 |
0.4 |
0.4 |
0.4 |
0.4 |
0.4 |
0% |
|
Other Trans/Mach |
0.2 |
0.0 |
0.0 |
0.1 |
0.1 |
0.1 |
0.1 |
0.1 |
0.1 |
0.1 |
0.1 |
0% |
|
Waste |
0.2 |
0.2 |
0.1 |
0.1 |
0.1 |
0.1 |
0.1 |
0.1 |
0.0 |
0.0 |
0.0 |
0% |
|
By FUEL TYPE |
||||||||||||
|
Solid |
118.4 |
84.8 |
70.4 |
71.3 |
67.7 |
59.0 |
51.9 |
40.1 |
36.8 |
27.1 |
29.9 |
35% |
|
Petroleum |
15.7 |
9.2 |
5.2 |
5.4 |
5.1 |
5.0 |
4.6 |
3.8 |
3.6 |
2.8 |
2.6 |
3% |
|
Gas |
0.0 |
0.0 |
0.0 |
0.0 |
0.0 |
0.0 |
0.0 |
0.0 |
0.0 |
0.0 |
0.0 |
0% |
|
Non-Fuel |
46.9 |
53.3 |
55.7 |
54.6 |
53.2 |
51.7 |
51.7 |
51.5 |
54.5 |
54.0 |
53.3 |
62% |
|
TOTAL |
181.1 |
147.3 |
131.3 |
131.2 |
126.0 |
115.7 |
108.3 |
95.4 |
94.9 |
84.0 |
85.8 |
100% |
1 See Appendix 4 for definition of UN/ECE Categories
Figure 6.9 UK Emissions of Selenium
Table 6.19 and Figure 6.10 summarise the UK emissions of vanadium. Emission data is rather scarce so the estimates are very uncertain. Emissions have declined by 84% since 1970. The major source of emissions is the combustion of fuel oils- liquid fuels accounting for some 87% of the estimated emission in 1998. The reduction in emissions reflects the decline in the use of fuel oils by the electricity supply industry, industry in general and the domestic sector. Since 1989, heavy fuel oil was partly replaced by Orimulsion (an emulsion of bitumen in water) in some power stations though this has now been discontinued. Emissions from refineries are very important because of the high consumption of refinery fuel oil and residues. The vanadium content of Orimulsion was higher than that of heavy fuel oil and resulted in higher emissions in spite of the flue gas cleaning equipment required on these power stations. Of the other sources, estimates for the iron and steel industry are very uncertain since emissions will depend on the type of steel or alloy produced and its vanadium content. The available emissions data apply only to a generalised steel production process.
Table 6.19 UK Emissions of Vanadium by UN/ECE Category (tonnes)
|
1970 |
1980 |
1990 |
1991 |
1992 |
1993 |
1994 |
1995 |
1996 |
1997 |
1998 |
1998% |
|
|
BY UN/ECE CATEGORY1 |
||||||||||||
|
Comb. in Energy Prod. |
||||||||||||
|
Public Power |
498 |
285 |
295 |
283 |
292 |
262 |
211 |
185 |
176 |
39 |
19 |
3% |
|
Public Power (waste) |
0 |
0 |
1 |
1 |
1 |
1 |
1 |
0 |
0 |
0% |
||
|
Petroleum Refining Plants |
559 |
527 |
292 |
324 |
333 |
346 |
357 |
332 |
332 |
332 |
335 |
48% |
|
Other Comb. & Trans. |
12 |
4 |
1 |
1 |
0 |
0 |
0 |
0 |
0 |
0 |
0 |
0% |
|
Comb. in Comm/Inst/Res |
||||||||||||
|
Residential Plant |
170 |
74 |
35 |
37 |
33 |
36 |
30 |
23 |
21 |
20 |
17 |
2% |
|
Comm/Pub/Agri Comb. |
655 |
295 |
143 |
144 |
154 |
161 |
163 |
137 |
126 |
92 |
73 |
11% |
|
Combustion in Industry |
||||||||||||
|
Iron & Steel Comb. |
156 |
39 |
23 |
23 |
22 |
27 |
26 |
26 |
22 |
22 |
16 |
2% |
|
Other Ind. Comb. |
2283 |
1268 |
539 |
601 |
602 |
576 |
518 |
370 |
307 |
217 |
187 |
27% |
|
Glass Production |
21 |
24 |
25 |
25 |
24 |
24 |
24 |
23 |
25 |
25 |
24 |
4% |
|
Production Processes |
8 |
3 |
6 |
5 |
5 |
5 |
5 |
5 |
6 |
6 |
6 |
1% |
|
Road Transport |
0 |
0 |
1 |
1 |
1 |
1 |
1 |
1 |
1 |
1 |
1 |
0% |
|
Other Trans/Mach |
51 |
11 |
11 |
16 |
17 |
21 |
26 |
29 |
23 |
17 |
14 |
2% |
|
Waste |
3 |
3 |
2 |
2 |
2 |
2 |
1 |
1 |
0 |
0 |
0 |
0% |
|
By FUEL TYPE |
||||||||||||
|
Solid |
339 |
156 |
109 |
114 |
110 |
103 |
90 |
71 |
65 |
54 |
49 |
7% |
|
Petroleum |
4035 |
2343 |
1222 |
1308 |
1336 |
1318 |
1234 |
1023 |
936 |
677 |
604 |
87% |
|
Gas |
0 |
0 |
0 |
0 |
0 |
0 |
0 |
0 |
0 |
0 |
0 |
0% |
|
Non-Fuel |
42 |
35 |
42 |
40 |
39 |
38 |
39 |
38 |
40 |
39 |
38 |
6% |
|
TOTAL |
4416 |
2534 |
1372 |
1462 |
1485 |
1459 |
1363 |
1132 |
1040 |
770 |
691 |
100% |
1 See Appendix 4 for definition of UN/ECE Categories
Figure 6.10 UK Emissions of Vanadium
Table 6.20 and Figure 6.11 summarise the UK emissions of zinc. Emissions of zinc have declined by 46% since 1970. The main sources are iron and steel production, non-ferrous metals manufacture, road transport and to a lesser extent coal combustion. The road transport emission is almost entirely due to tyre wear. This arises from the zinc content of the tyre rubber - around 2% ZnO by weight. The reduction in emissions over the period considered is largely due to the decline in coal combustion and improvements in abatement measures in the iron and steel industry. The large reduction in waste emissions is due to improved controls on MSW incinerators from 1997 onwards and their conversion to power generating plant. However new emission data reported in the Pollution inventory has led to emissions being revised upwards for recent years. The main revisions to the inventory are a small increase in coke oven emissions in ‘processes in industry’ and a new large source in ‘other industrial combustion’ – copper refining. Also there is a small decrease in cement kiln emissions under ‘industrial combustion’.
Table 6.20 UK Emissions of Zinc by UN/ECE Category (tonnes)
|
1970 |
1980 |
1990 |
1991 |
1992 |
1993 |
1994 |
1995 |
1996 |
1997 |
1998 |
1998% |
|
|
BY UN/ECE CATEGORY1 |
||||||||||||
|
Comb. in Energy Prod. |
||||||||||||
|
Public Power |
31 |
32 |
30 |
29 |
27 |
22 |
19 |
15 |
14 |
9 |
12 |
1% |
|
Public Power (waste) |
37 |
38 |
46 |
64 |
114 |
83 |
56 |
24 |
20 |
2% |
||
|
Petroleum Refining Plants |
3 |
3 |
2 |
2 |
2 |
2 |
2 |
2 |
2 |
2 |
2 |
0% |
|
Other Comb. & Trans. |
36 |
13 |
2 |
2 |
1 |
1 |
0 |
0 |
0 |
0 |
0 |
0% |
|
Comb. in Comm/Inst/Res |
||||||||||||
|
Residential Plant |
35 |
17 |
9 |
10 |
9 |
9 |
8 |
6 |
7 |
6 |
6 |
1% |
|
Comm/Pub/Agri Comb. |
130 |
46 |
27 |
26 |
21 |
19 |
15 |
11 |
12 |
13 |
8 |
1% |
|
Combustion in Industry |
||||||||||||
|
Iron & Steel Comb. |
37 |
12 |
14 |
13 |
13 |
13 |
13 |
13 |
13 |
12 |
12 |
1% |
|
Other Ind. Comb. |
343 |
117 |
109 |
119 |
134 |
123 |
112 |
100 |
81 |
70 |
58 |
6% |
|
Non-Ferrous Metals |
316 |
302 |
327 |
302 |
334 |
353 |
330 |
281 |
320 |
370 |
328 |
31% |
|
Glass Production |
28 |
32 |
33 |
33 |
32 |
31 |
31 |
31 |
33 |
32 |
32 |
3% |
|
Production Processes |
||||||||||||
|
Processes in Industry |
37 |
33 |
14 |
10 |
8 |
5 |
6 |
5 |
5 |
5 |
5 |
0% |
|
Iron & Steel |
590 |
452 |
512 |
412 |
393 |
373 |
347 |
322 |
312 |
328 |
296 |
28% |
|
Non-Ferrous Metals |
1 |
4 |
3 |
3 |
2 |
2 |
2 |
2 |
2 |
3 |
3 |
0% |
|
Road Transport |
||||||||||||
|
Combustion |
0 |
1 |
1 |
1 |
1 |
1 |
1 |
1 |
1 |
1 |
1 |
0% |
|
Brake & Tyre Wear |
113 |
155 |
232 |
235 |
233 |
234 |
241 |
246 |
253 |
257 |
262 |
25% |
|
Other Trans/Mach |
0 |
0 |
0 |
0 |
0 |
0 |
0 |
0 |
0 |
0 |
0 |
0% |
|
Waste |
230 |
231 |
193 |
193 |
185 |
167 |
128 |
89 |
48 |
3 |
3 |
0% |
|
By FUEL TYPE |
||||||||||||
|
Solid |
574 |
215 |
170 |
178 |
186 |
168 |
148 |
126 |
108 |
93 |
80 |
8% |
|
Petroleum |
26 |
15 |
9 |
9 |
9 |
8 |
8 |
6 |
6 |
5 |
4 |
0% |
|
Gas |
0 |
0 |
0 |
0 |
0 |
0 |
0 |
0 |
0 |
0 |
0 |
0% |
|
Non-Fuel |
1331 |
1217 |
1366 |
1240 |
1247 |
1244 |
1213 |
1075 |
1044 |
1036 |
963 |
92% |
|
TOTAL |
1931 |
1448 |
1545 |
1427 |
1441 |
1420 |
1369 |
1207 |
1158 |
1134 |
1047 |
100% |
1 See Appendix 4 for definition of UN/ECE Categories
Figure 6.11 UK Emissions of Zinc
Spatial Disaggregation of Heavy Metals
All of the heavy metal emission estimates presented here have been spatially disaggregated, and UK maps are presented in Figures 6.12 to 6.21. The key features that are evident from the maps are briefly considered here:
Arsenic
Significant emission arise from coal combustion, and consequently emissions in Northern Ireland are noted to be relatively high. Individual points sources are also evident.
Cadmium
The major source for 1998 arises from activities associated with non-ferrous metals. This proves difficult to identify from the UK map.
Chromium and Copper
The dominant sources of Chromium are coal combustion and iron and steel production processes, and for Copper- coal combustion, iron and steel manufacture and non-ferrous metals production. From the UK emission maps it can be seen that there are a number of point sources, and elevated emissions in Northern Ireland for both of these pollutants.
Lead
In 1998 the majority of lead emissions arise from road transport activities, although a significant contribution comes from the non-ferrous metal industry. The major road network is clearly visible from the UK emission map indicating the dominant source sector.
Mercury
The major sources of mercury in 1998 were waste incineration, coal combustion and specific industrial activities. As a result the UK emission map highlights a number of point sources with a more widespread coverage.
Nickel
Emissions of Nickel are dominated by the combustion of coal and heavy fuel oil. Consequently areas of the country with refinery activities are highlighted. It is also interesting to note that urban areas are not elevated, with high population density areas often resulting in lower emissions per 1x1 km grid cell. This is due to the higher use of gas in the domestic sector in areas of higher population density.
Selenium
Emissions of selenium are dominated by the glass industry and coal combustion. Consequently the UK emissions map displays some major point sources, and other areas with very low emissions.
Vanadium
Vanadium emission primarily arise from the combustion of heavy fuel oils- in the refinery and industrial sectors. As a result a large number of point sources may be identified from the emissions map, and large conurbations/areas of high population density show low emissions.
Zinc
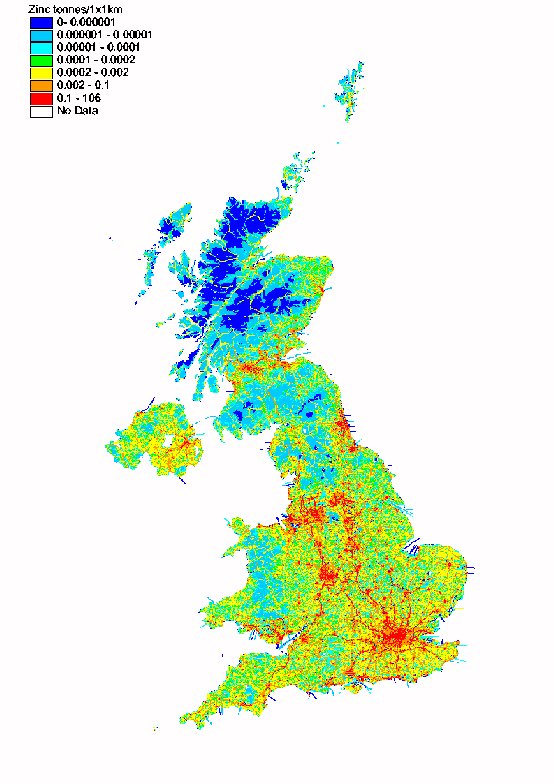
Zinc emissions primarily arise from combustion in the non-ferrous metals sector, iron and steel production processes and road transport (brake and tyre wear). As a result the UK emissions map highlights the road network and a number of point sources. However, the point sources are difficult to see due to the large number of grid cells that are impacted upon by emissions from the road transport sector.
Fig 6.12 Spatially Disaggregated UK Emissions- Arsenic
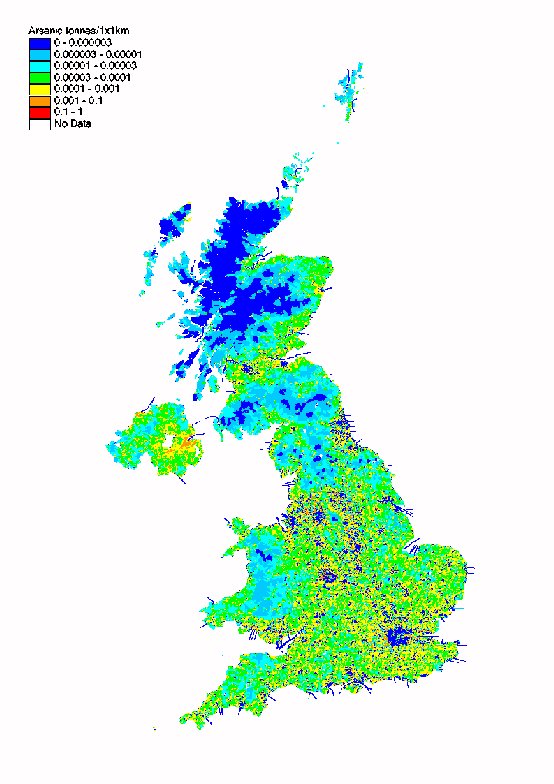
Fig 6.13 Spatially Disaggregated UK Emissions-Cadmium
Fig 6.14 Spatially Disaggregated UK Emissions Chromium
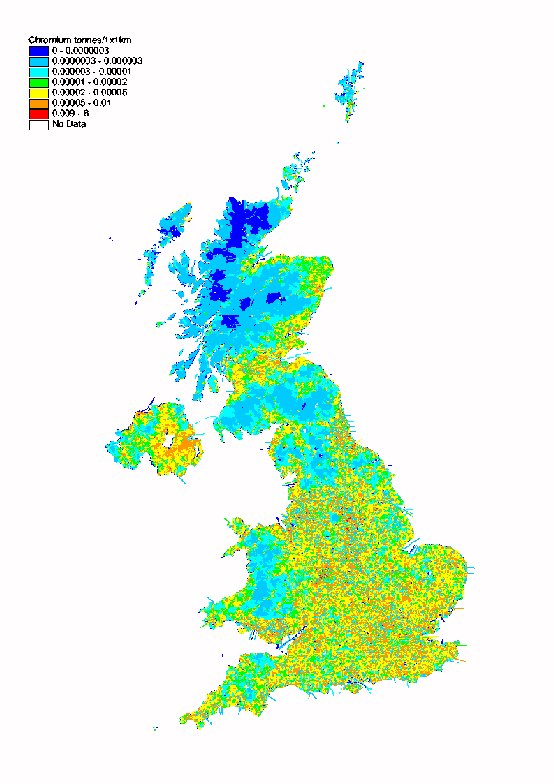
Fig 6.15 Spatially Disaggregated UK Emissions- Copper
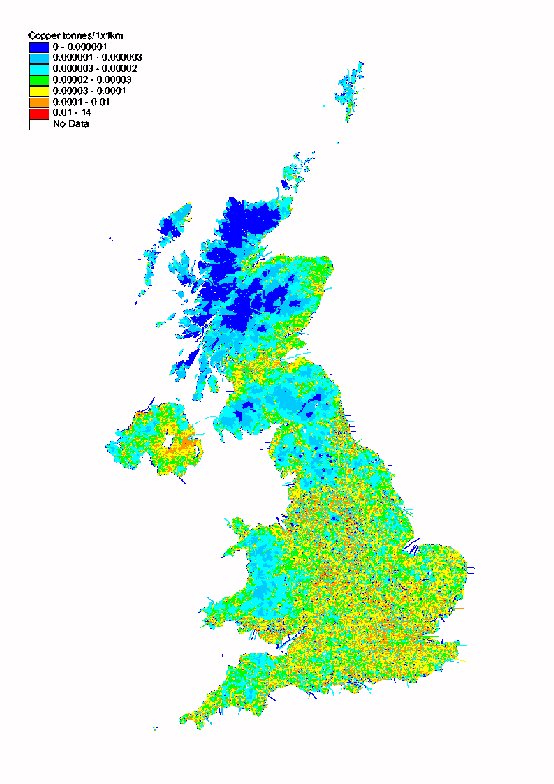
Fig 6.16 Spatially Disaggregated UK Emissions of Lead
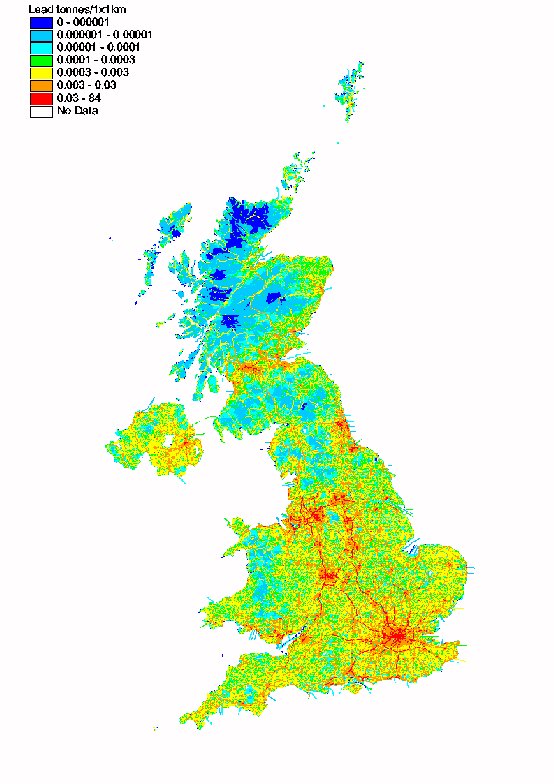
Fig 6.17 Spatially Disaggregated UK Emissions of Mercury
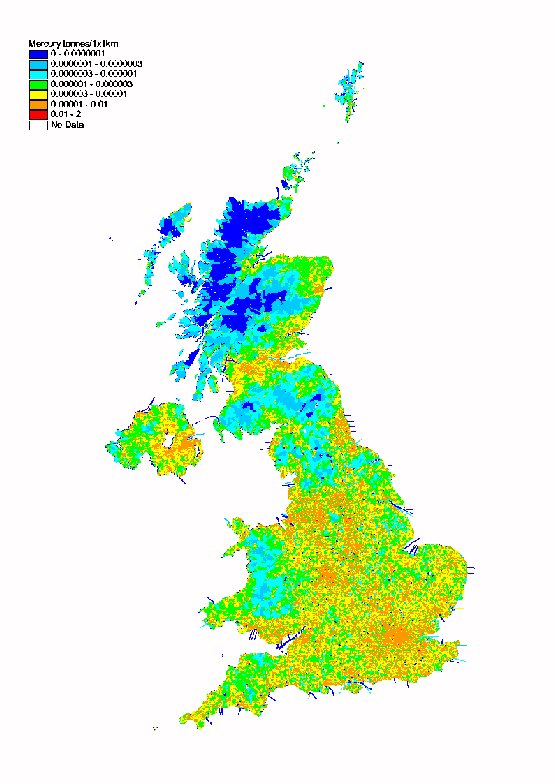
Fig 6.18 Spatially Disaggregated UK Emissions of Nickel
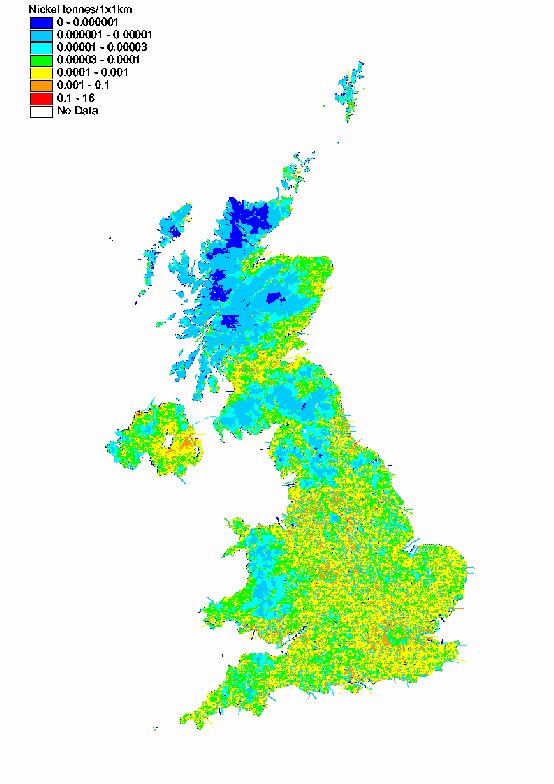
Fig 6.19 Spatially Disaggregated UK Emissions- Selenium
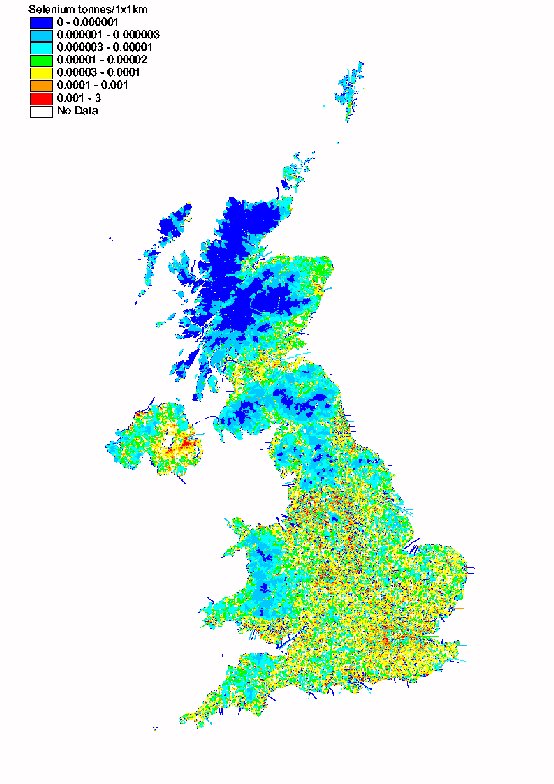
Fig 6.20 Spatially Disaggregated UK Emissions- Vanadium

Figure 6.21 Spatially Disaggregated UK Emissions of Zinc