
Benzene
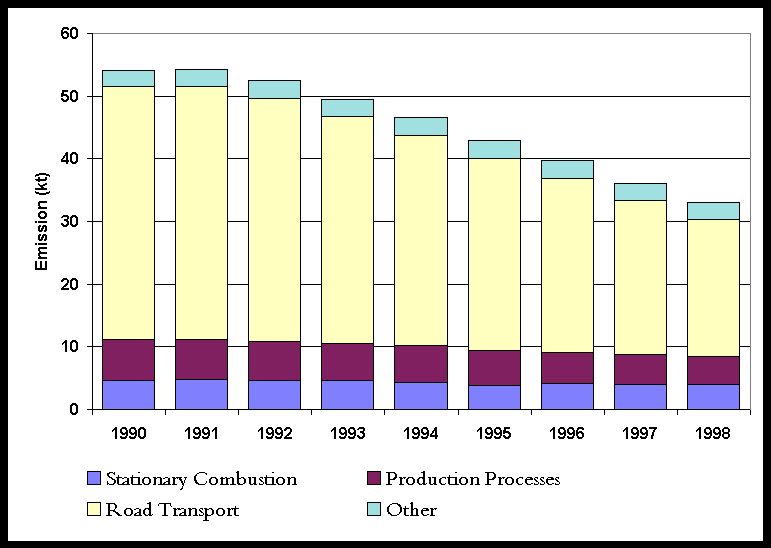
Benzene emissions arise predominately from the evaporation and combustion of petroleum products. Emissions of benzene are dominated by the road transport sector, accounting for 66% of the 1998 emission estimate total. As benzene is a constituent of petrol, emissions arise from both evaporative and combustion of petrol. Benzene emissions for 1990 to 1998 are given in Table 4.10 and Figure 4.8 below.
Benzene emissions also arise as stack emissions and, more importantly, fugitive emissions from its manufacture and use in the chemical industry. Benzene is a major chemical intermediate, being used in the manufacture of many important chemicals including those used for the production of foams, fibres, coatings, detergents, solvents and pesticides.
Benzene emissions have been steadily decreasing since 1990. These decreases are primarily due to the introduction of cars equipped with catalytic converters since 1991. The increasing number of cars in the national vehicle fleet that are equipped with catalytic converters maintains the steady decrease in the total benzene emissions as the reductions from other source sectors are small by comparison.
Table 4.10 UK emissions of Benzene from 1990 to 1998 (ktonnes)
|
1990 |
1991 |
1992 |
1993 |
1994 |
1995 |
1996 |
1997 |
1998 |
1998% |
|
|
BY UN/ECE CATEGORY1 |
||||||||||
|
Comb. in Energy Prod. |
||||||||||
|
Petroleum Refining Plants |
0.31 |
0.30 |
0.30 |
0.30 |
0.32 |
0.12 |
0.14 |
0.14 |
0.15 |
0% |
|
Other Comb. & Trans. |
0.00 |
0.00 |
0.00 |
0.01 |
0.00 |
0.01 |
0.01 |
0.01 |
0.01 |
0% |
|
Comb. in Comm/Inst/Res |
||||||||||
|
Residential Plant |
0.11 |
0.12 |
0.12 |
0.12 |
0.12 |
0.13 |
0.15 |
0.14 |
0.14 |
0% |
|
Comm/Pub/Agri Comb. |
3.45 |
3.58 |
3.43 |
3.43 |
3.09 |
2.80 |
2.95 |
2.84 |
2.85 |
9% |
|
Combustion in Industry |
||||||||||
|
Iron & Steel Comb. |
0.31 |
0.32 |
0.30 |
0.30 |
0.25 |
0.26 |
0.26 |
0.27 |
0.26 |
1% |
|
Other Ind. Comb. |
0.51 |
0.49 |
0.47 |
0.47 |
0.50 |
0.54 |
0.57 |
0.57 |
0.58 |
2% |
|
Production Processes |
6.41 |
6.30 |
6.20 |
5.97 |
5.93 |
5.57 |
5.07 |
4.74 |
4.48 |
14% |
|
Extr./Distrib. of Fossil Fuels |
0.82 |
1.03 |
1.07 |
1.03 |
1.11 |
1.14 |
1.17 |
1.15 |
1.15 |
3% |
|
Road Transport |
||||||||||
|
Combustion |
38.19 |
38.20 |
36.60 |
34.11 |
31.69 |
28.93 |
26.14 |
23.13 |
20.56 |
62% |
|
Evaporation |
2.24 |
2.22 |
2.16 |
2.02 |
1.88 |
1.72 |
1.60 |
1.47 |
1.34 |
4% |
|
Other Trans/Mach |
1.59 |
1.66 |
1.71 |
1.67 |
1.63 |
1.55 |
1.57 |
1.51 |
1.48 |
4% |
|
Waste |
0.10 |
0.10 |
0.09 |
0.09 |
0.09 |
0.08 |
0.08 |
0.08 |
0.07 |
0% |
|
Land Use Change |
0 |
0 |
0 |
0 |
0 |
0 |
0 |
0 |
0 |
0% |
|
TOTAL |
54.05 |
54.32 |
52.47 |
49.51 |
46.62 |
42.85 |
39.72 |
36.04 |
33.07 |
100% |
1 See Appendix 4 for definition of UN/ECE Categories
Figure 4.8 Time Series of Benzene Emissions

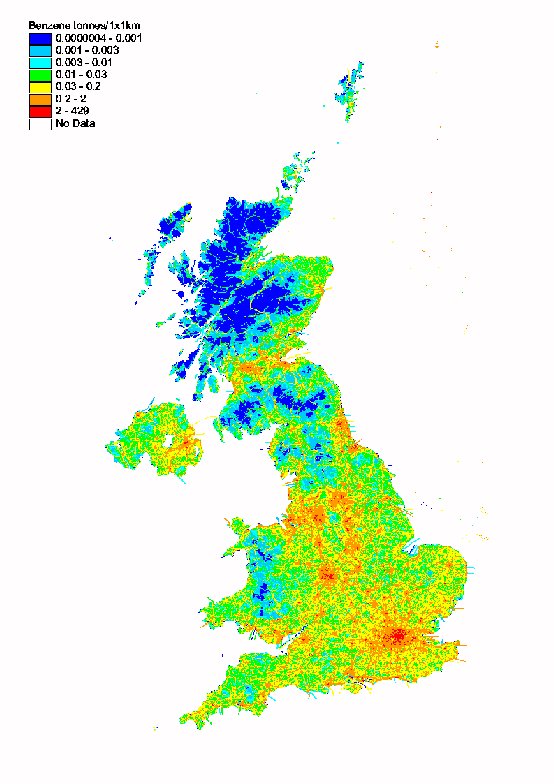
Spatially disaggregated emissions of benzene are shown in Figure 4.9. A high percentage of the total benzene emission arises from the road transport sector, and this is evident in the spatially disaggregated UK map. High emission densities (i.e. emission per 1x1 km grid square) may be found in areas of high population density, and it is apparent that the dominant emissions are arising from the road transport activities in these areas, although other urban sources do also make a significant contribution.
Emissions of benzene fall with increasing speed (and then start rising at higher speeds). This results in relatively high emissions per km in urban areas, as can be seen in Figure 4.9. Although evident, motorways and other major roads are not particularly highlighted.
Figure 4.9 Spatially Disaggregated UK Emissions of Benzene
