

Carbon monoxide emission estimates
Carbon monoxide arises from incomplete fuel-combustion and is of concern mainly because of its effect on human health and its role in tropospheric ozone formation. It leads to a decreased uptake of oxygen by the lungs and can lead to a range of symptoms as the concentration increases.
The UK emissions of carbon monoxide are shown in Figure 4.6 and Table 4.9 disaggregated by source and fuel. Over the period 1970-1998 emissions decreased by 43% reflecting significant reduction in emissions from road transport, domestic and agricultural sectors.
Figure 4.6 Time Series CO Emissions
The spatial disaggregation of CO emissions is shown in Figure 4.7. The observed pattern of emissions is clearly dominated by road transport emissions. A large proportion of road transport emissions are from vehicles travelling at slow speeds on urban or minor roads, hence the map shows high emissions in urban conurbations.
Figure 4.7 Spatially Disaggregated UK Emissions of CO
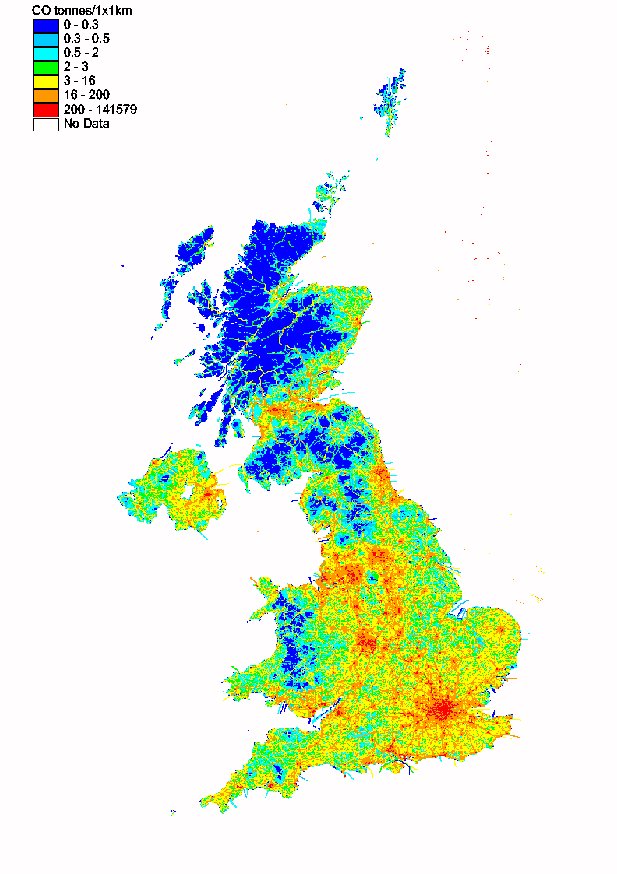
The most important source is road transport and in particular petrol driven vehicles. Emissions from road transport fell only slightly between 1970 and 1990 but in recent years have declined more significantly. This is due primarily to the increased use of catalytic converters and to a lesser extent to fuel switching from petrol cars to diesel cars. The emissions from off-road sources includes portable generators, fork lift trucks, lawnmowers and cement mixers. The estimation of emissions from such machinery is very uncertain since it is based on estimates of equipment population and annual usage time.
Table 4.9 UK Emissions of Carbon Monoxide by UN/ECE1 Source Category and Fuel (kt)
|
1970 |
1980 |
1990 |
1991 |
1992 |
1993 |
1994 |
1995 |
1996 |
1997 |
1998 |
1998% |
|
|
BY UN/ECE CATEGORY2 |
||||||||||||
|
Comb. in Energy Prod. |
||||||||||||
|
Public Power |
117 |
121 |
114 |
113 |
110 |
100 |
106 |
104 |
102 |
70 |
73 |
2% |
|
Petroleum Refining Plants |
4 |
4 |
5 |
6 |
6 |
6 |
6 |
6 |
6 |
7 |
7 |
0% |
|
Other Comb. & Trans. |
45 |
24 |
22 |
22 |
20 |
20 |
20 |
22 |
23 |
23 |
26 |
1% |
|
Comb. in Comm/Inst/Res |
||||||||||||
|
Residential Plant |
1251 |
622 |
358 |
382 |
347 |
369 |
324 |
260 |
268 |
251 |
234 |
5% |
|
Comm/Pub/Agri Comb. |
46 |
26 |
22 |
22 |
21 |
21 |
20 |
19 |
19 |
19 |
18 |
0% |
|
Combustion in Industry |
||||||||||||
|
Iron & Steel Comb. |
220 |
63 |
108 |
102 |
106 |
105 |
97 |
98 |
98 |
100 |
96 |
2% |
|
Other Ind. Comb. |
140 |
80 |
77 |
73 |
73 |
72 |
73 |
69 |
62 |
62 |
52 |
1% |
|
Production Processes |
362 |
271 |
412 |
389 |
373 |
377 |
391 |
397 |
410 |
419 |
413 |
9% |
|
Extr./Distrib. of Fossil Fuels |
2 |
2 |
7 |
3 |
3 |
2 |
3 |
3 |
3 |
3 |
3 |
0% |
|
Road Transport |
5427 |
5378 |
5147 |
5026 |
4759 |
4465 |
4227 |
3969 |
3926 |
3665 |
3479 |
73% |
|
Other Trans/Mach |
||||||||||||
|
Off-Road Sources |
475 |
412 |
339 |
353 |
360 |
347 |
339 |
319 |
329 |
315 |
310 |
7% |
|
Other3 |
29 |
28 |
31 |
30 |
30 |
30 |
29 |
29 |
30 |
29 |
29 |
1% |
|
Waste |
2 |
43 |
29 |
27 |
26 |
26 |
33 |
24 |
24 |
19 |
18 |
0% |
|
Land Use Change |
288 |
449 |
266 |
228 |
165 |
4 |
0 |
0 |
0 |
0 |
0 |
0% |
|
By FUEL TYPE |
||||||||||||
|
Solid |
1666 |
772 |
532 |
548 |
509 |
510 |
457 |
389 |
387 |
345 |
324 |
7% |
|
Petroleum |
5966 |
5839 |
5534 |
5427 |
5167 |
4859 |
4609 |
4332 |
4299 |
4020 |
3828 |
80% |
|
Gas |
42 |
34 |
37 |
37 |
40 |
46 |
50 |
53 |
56 |
53 |
55 |
1% |
|
Non-Fuel |
734 |
880 |
835 |
762 |
684 |
528 |
550 |
545 |
557 |
563 |
551 |
12% |
|
TOTAL |
8407 |
7525 |
6938 |
6774 |
6399 |
5943 |
5665 |
5320 |
5299 |
4982 |
4758 |
100% |
1 UK emissions reported in IPCC format (Salway, 1999) differ slightly due to the different source categories used.
2 See Appendix 4 for definition of UN/ECE Categories
3 Including railways, shipping, naval vessels, military aircraft
Other emission sources of CO are small compared with transport and off-road sources. Emissions from the domestic sector have decreased by 81% since 1970 due to the decline in the use of solid fuels in favour of gas and electricity. The sudden decline in emissions from the agricultural sector reflects the banning of stubble burning in 1993 in England and Wales. Currently power stations account for only 2% of UK emissions.
CO emissions depend on the technology employed and the specific combustion conditions. The emission factors used in the inventory have been derived from relatively few measurements of emissions from different types of boiler, hence they are less accurate than CO2 and SO2 emissions. Likewise CO emissions from road transport are subject to the same uncertainties surrounding NOx emissions. It is estimated that CO emissions are accurate to ± 40%.