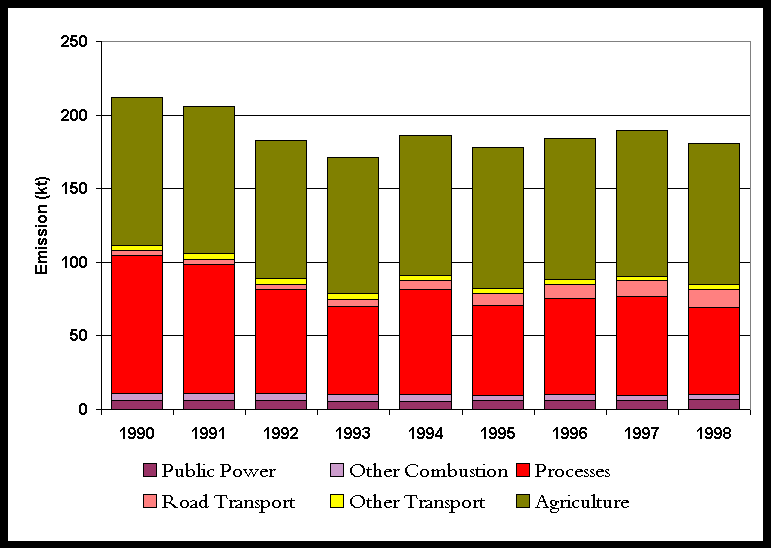

The two major sources of nitrous oxide emissions in the UK are agricultural soils and the manufacture of adipic and nitric acids. Lower levels of emissions arise from combustion processes in the power generation sector and from road transport (Table 2.6 and Figure 2.7).
Table 2.6 UK Emissions of Nitrous Oxide (N2O) by UN/ECE1 Category(kt)
|
1970 |
1980 |
1990 |
1991 |
1992 |
1993 |
1994 |
1995 |
1996 |
1997 |
1998 |
1998% |
|
|
BY UN/ECE CATEGORY2 |
||||||||||||
|
Comb. in Energy Prod. |
||||||||||||
|
Public Power |
6.3 |
6.2 |
5.9 |
5.5 |
5.7 |
5.8 |
6.0 |
6.1 |
6.5 |
4% |
||
|
Petroleum Refining Plants |
0.3 |
0.3 |
0.3 |
0.3 |
0.3 |
0.4 |
0.3 |
0.4 |
0.4 |
0% |
||
|
Other Comb. & Trans. |
0.2 |
0.2 |
0.2 |
0.2 |
0.2 |
0.2 |
0.3 |
0.3 |
0.3 |
0% |
||
|
Comb. in Comm/Inst/Res |
1.2 |
1.3 |
1.2 |
1.2 |
1.1 |
0.9 |
0.9 |
0.9 |
0.8 |
0% |
||
|
Combustion in Industry |
2.0 |
2.0 |
2.2 |
2.0 |
1.9 |
1.8 |
1.7 |
1.6 |
1.4 |
1% |
||
|
Production Processes |
93.9 |
87.8 |
70.8 |
60.1 |
71.3 |
61.1 |
65.3 |
66.8 |
59.4 |
33% |
||
|
Road Transport |
3.2 |
3.3 |
3.7 |
4.9 |
6.4 |
7.9 |
9.4 |
10.9 |
12.4 |
7% |
||
|
Other Trans/Mach3 |
3.6 |
3.7 |
3.7 |
3.6 |
3.5 |
3.3 |
3.5 |
3.2 |
3.2 |
2% |
||
|
Waste |
0.9 |
0.9 |
0.9 |
0.8 |
0.8 |
0.7 |
0.7 |
0.5 |
0.5 |
0% |
||
|
Land Use Change |
||||||||||||
|
Animal Wastes |
5.1 |
5.1 |
5.0 |
5.0 |
5.1 |
5.0 |
5.1 |
5.0 |
5.0 |
3% |
||
|
Non Livestock Agricult. |
95.3 |
94.8 |
89.3 |
87.5 |
89.9 |
90.5 |
90.9 |
93.8 |
90.7 |
50% |
||
|
By FUEL TYPE |
||||||||||||
|
Solid |
8.5 |
8.5 |
8.1 |
7.0 |
6.5 |
5.9 |
5.4 |
4.7 |
4.6 |
3% |
||
|
Petroleum |
7.5 |
7.8 |
8.2 |
9.3 |
10.7 |
12.1 |
13.7 |
14.9 |
16.3 |
9% |
||
|
Gas |
0.5 |
0.5 |
0.6 |
1.2 |
1.6 |
2.0 |
2.6 |
3.3 |
3.6 |
2% |
||
|
Non-Fuel |
195.4 |
188.8 |
166.1 |
153.7 |
167.3 |
157.7 |
162.4 |
166.6 |
156.2 |
86% |
||
|
TOTAL |
211.9 |
205.6 |
183.1 |
171.2 |
186.1 |
177.7 |
184.1 |
189.5 |
180.7 |
100% |
1 UK emissions reported in IPCC format (Salway, 1999) differ slightly due to the different source categories used.
2 See Appendix 4 for definition of UN/ECE Categories
3 Including railways, shipping, naval vessels, military aircraft and off-road sources
Figure 2.6 Time Series of N2O Emissions

The calculation of emissions from agricultural soils and animal wastes have been considerably extended in the last several years, in particular publication of the Revised 1996 IPCC Guidelines (IPCC, 1997) have enabled a greater number of sources to be considered. Further details of the methodology are given in Appendices 1 and 3.
The emissions from agricultural soils currently account for around 50% of total UK emissions. The most significant sources are fertiliser application and leaching.
Nitrous oxide emissions from adipic acid manufacture (a feedstock for nylon) and nitric acid manufacture comprise 33% of the total in 1998. The extent of the emission depends on the production of these acids, hence the time series reflects production levels. The UK manufacturer has recently commissioned an abatement unit that should reduce emissions by at least 95%.
The contribution from public power generation has been relatively constant between 1990 and 1998 in spite of the trend away from coal towards natural gas combustion.
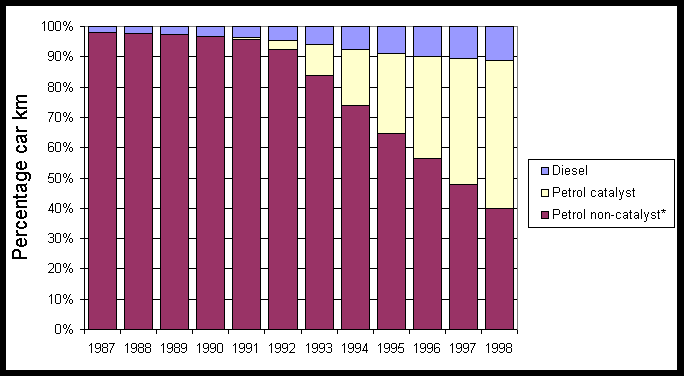
Emissions from the road transport sector have increased significantly since 1992. This is as a direct result of the introduction of three way catalytic converters which produce significantly larger emissions of nitrous oxide than cars not equipped with abatement technology. Between 1990 and 1998, the proportion of the car kilometres with converters has increased from <1% to 49% (Figure 2.7) and emissions have greatly increased. The contribution of road transport to the total N2O emission is small; however, emissions from the majority of the significant sectors are expected to decrease with time, whereas the emission from the road transport sector are expected to increase.
Figure 2.7 The growth in number of cars with catalytic converters

*Includes cars with failed catalysts.