6.3 Heavy metal emission estimates
6.3.1 Introduction
The NAEI currently reports emissions of ten heavy metals. These are:
Table 6.8 and Figure 6.1 summarise the UK emissions of arsenic. Emissions have declined by 78% since 1970. The main source of emissions is coal combustion with other sources being very small in comparison. Coal use declined over the period considered, in favour of natural gas use. The emission from coal fired power stations has been revised downwards significantly since the 1995 Inventory.
| 1970 | 1975 | 1980 | 1985 | 1990 | 1993 | 1994 | 1995 | 1996 | 1996% | |
| By UNECE Category | ||||||||||
| Comb in Energy Prod & Trans | 26 | 23 | 23 | 18 | 19 | 14 | 11 | 9 | 7 | 14 |
| Comb in Comm/Inst/Res/Agri | ||||||||||
| Domestic | 88 | 51 | 39 | 38 | 19 | 20 | 17 | 12 | 12 | 23 |
| Other | 19 | 9.1 | 8.4 | 7.9 | 5.6 | 3.9 | 3.4 | 2.4 | 2.7 | 5 |
| Combustion in Industry | ||||||||||
| Treated Wood | 9 | 9 | 9 | 9 | 9 | 9 | 9 | 9 | 9 | 18 |
| Iron & Steel | 4.1 | 1.6 | 1.0 | 0.4 | 0.3 | 0.3 | 0.2 | 0.5 | 0.7 | 1 |
| Other Combustion in Industry | 73 | 30 | 24 | 23 | 23 | 24 | 21 | 18 | 13 | 26 |
| Non-Ferrous Metals | 2.9 | 2.5 | 3.1 | 3.2 | 3.2 | 3.4 | 3.3 | 3.0 | 3.2 | 6 |
| Cement | 0.2 | 0.2 | 0.2 | 0.1 | 0.2 | 0.1 | 0.1 | 0.1 | 0.1 | 0 |
| Glass production | 0.8 | 0.8 | 0.8 | 0.8 | 0.8 | 0.8 | 0.8 | 0.8 | 0.8 | 2 |
| Production Processes | ||||||||||
| Processes in Industry | 0.0 | 0.0 | 0.0 | 0.0 | 0.0 | 0.0 | 0.0 | 0.0 | 0.0 | 0 |
| Iron & Steel | 2.4 | 1.9 | 1.2 | 1.6 | 1.8 | 1.7 | 1.7 | 1.7 | 1.8 | 3 |
| Extr./Distrib. of Fossil Fuels | 0.0 | 0.0 | 0.0 | 0.0 | 0.0 | 0.0 | 0.0 | 0.0 | 0.0 | 0 |
| Road Transport | 0.0 | 0.0 | 0.0 | 0.0 | 0.0 | 0.0 | 0.0 | 0.0 | 0.0 | 0 |
| Other Transp & Mach. | 0.0 | 0.0 | 0.0 | 0.0 | 0.0 | 0.0 | 0.0 | 0.0 | 0.0 | 0 |
| Waste Treatment & Disp. | 1.1 | 1.1 | 1.1 | 1.1 | 0.9 | 0.8 | 0.6 | 0.5 | 0.3 | 1 |
| Total | 228 | 129 | 110 | 103 | 82 | 78 | 68 | 57 | 51 | 100 |

Table 6.9 and Figure 6.2 summarise the UK emissions of cadmium. Emissions have declined by 51% since 1970. The main sources are waste incineration, non-ferrous metal production and iron and steel manufacture. The estimate for energy production includes a significant proportion from waste combustion and fuel oil combustion for electricity generation. The decline in emissions is a result of the general fall in coal combustion, the decline in fuel oil combustion in power generation and recent improvements in waste incineration plant.
| 1970 | 1975 | 1980 | 1985 | 1990 | 1993 | 1994 | 1995 | 1996 | 1996% | |
| By UNECE Category | ||||||||||
| Comb in Energy Prod & Trans | 11.6 | 12.2 | 7.6 | 9.5 | 8.6 | 6.7 | 7.1 | 6.1 | 4.7 | 25 |
| Comb in Comm/Inst/Res/Agri | ||||||||||
| Domestic | 2.1 | 1.3 | 1.0 | 1.0 | 0.5 | 0.6 | 0.5 | 0.4 | 0.4 | 2 |
| Other | 0.5 | 0.3 | 0.2 | 0.2 | 0.2 | 0.1 | 0.1 | 0.1 | 0.1 | 0 |
| Combustion in Industry | ||||||||||
| Iron & Steel | 1.8 | 1.4 | 0.8 | 0.7 | 0.8 | 0.8 | 0.7 | 0.6 | 0.5 | 3 |
| Other Combustion in Industry | 1.9 | 0.8 | 0.7 | 0.6 | 0.6 | 0.6 | 0.5 | 0.5 | 0.4 | 2 |
| Non-ferrous Metals | 6.1 | 5.1 | 5.2 | 6.4 | 6.6 | 8.5 | 7.8 | 6.3 | 7.0 | 37 |
| Cement | 0.3 | 0.3 | 0.3 | 0.2 | 0.3 | 0.2 | 0.2 | 0.2 | 0.2 | 1 |
| Glass production | 0.3 | 0.4 | 0.4 | 0.3 | 0.4 | 0.4 | 0.4 | 0.4 | 0.3 | 2 |
| Production Processes | ||||||||||
| Processes in Industry | 0.4 | 0.4 | 0.4 | 0.4 | 0.4 | 0.3 | 0.3 | 0.3 | 0.3 | 2 |
| Iron & Steel | 3.5 | 3.2 | 2.4 | 2.6 | 2.7 | 2.1 | 2.0 | 1.9 | 1.9 | 10 |
| Extr./Distrib. of Fossil Fuels | 0.0 | 0.0 | 0.0 | 0.0 | 0.0 | 0.0 | 0.0 | 0.0 | 0.0 | 0 |
| Road Transport | 0.2 | 0.3 | 0.3 | 0.3 | 0.4 | 0.4 | 0.4 | 0.4 | 0.5 | 2 |
| Other Transp & Mach. | 0.0 | 0.0 | 0.0 | 0.0 | 0.0 | 0.0 | 0.0 | 0.0 | 0.0 | 0 |
| Waste Treatment & Disp. | 9.4 | 9.4 | 9.4 | 9.5 | 8.2 | 7.5 | 6.3 | 4.5 | 2.6 | 14 |
| Total | 38.2 | 35.1 | 28.9 | 31.8 | 29.8 | 28.2 | 26.3 | 21.8 | 18.8 | 100 |

Table 6.10 and Figure 6.3 summarise the UK emissions of chromium. Emissions have declined by 67% since 1970. The main sources are coal combustion with small contributions from waste incineration, iron and steel production and glass production. The estimates for coal fired power stations have been revised upwards based on new data.
| 1970 | 1975 | 1980 | 1985 | 1990 | 1993 | 1994 | 1995 | 1996 | 1996% | |
| By UNECE Category | ||||||||||
| Comb in Energy Prod & Trans | 56.9 | 53.9 | 62.7 | 51.4 | 58.8 | 45.1 | 38.1 | 32.2 | 25.7 | 46 |
| Comb in Comm/Inst/Res/Agri | ||||||||||
| Domestic | 30.6 | 17.7 | 13.6 | 13.1 | 6.5 | 7.1 | 5.9 | 4.1 | 4.1 | 7 |
| Other | 7.6 | 3.8 | 3.8 | 3.4 | 2.4 | 1.8 | 1.6 | 1.2 | 1.3 | 2 |
| Combustion in Industry | ||||||||||
| Iron & Steel | 4.6 | 2.8 | 1.6 | 1.5 | 1.7 | 1.6 | 1.5 | 1.6 | 1.6 | 3 |
| Other Combustion in Industry | 31.5 | 15.2 | 11.8 | 9.7 | 7.8 | 7.9 | 6.8 | 5.5 | 3.9 | 7 |
| Non-ferrous Metals | 0.0 | 0.0 | 0.0 | 0.0 | 0.0 | 0.0 | 0.0 | 0.0 | 0.0 | 0 |
| Cement | 1.7 | 1.7 | 1.5 | 1.3 | 1.4 | 1.0 | 1.2 | 1.2 | 1.1 | 2 |
| Glass production | 6.0 | 6.6 | 7.0 | 6.2 | 7.2 | 6.7 | 6.8 | 6.8 | 6.6 | 12 |
| Production Processes | ||||||||||
| Processes in Industry | 0.0 | 0.0 | 0.0 | 0.0 | 0.0 | 0.0 | 0.0 | 0.0 | 0.0 | 0 |
| Iron & Steel | 16.1 | 15.1 | 11.5 | 12.2 | 12.7 | 9.1 | 8.4 | 7.8 | 7.6 | 14 |
| Extr./Distrib. of Fossil Fuels | 0.0 | 0.0 | 0.0 | 0.0 | 0.0 | 0.0 | 0.0 | 0.0 | 0.0 | 0 |
| Road Transport | 0.2 | 0.2 | 0.2 | 0.3 | 0.3 | 0.4 | 0.4 | 0.4 | 0.4 | 1 |
| Other Transp & Mach. | 0.0 | 0.0 | 0.0 | 0.0 | 0.0 | 0.0 | 0.0 | 0.0 | 0.0 | 0 |
| Waste Treatment & Disp. | 13.1 | 13.1 | 13.1 | 13.1 | 10.9 | 9.6 | 7.2 | 5.2 | 3.0 | 5 |
| Total | 168.5 | 130.3 | 126.8 | 112.3 | 109.7 | 90.3 | 78.1 | 65.9 | 55.4 | 100 |

Table 6.11 and Figure 6.4 summarise the UK emissions of copper. Emissions have declined by 67% since 1970. The main sources are coal combustion, waste incineration, iron and steel manufacture and non-ferrous metals production. Emissions have declined over the period due to the decline in coal combustion and to a lesser extent the combustion of heavy fuel oil. The estimates for coal fired power stations have been revised upwards based on new data. The effect of stricter controls on waste incineration emissions are apparent from 1995 onwards.
| 1970 | 1975 | 1980 | 1985 | 1990 | 1993 | 1994 | 1995 | 1996 | 1996% | |
| By UNECE Category | ||||||||||
| Comb in Energy Prod & Trans | 49.9 | 46.9 | 53.5 | 43.8 | 50.7 | 40.1 | 35.7 | 30.2 | 24.2 | 37 |
| Comb in Comm/Inst/Res/Agri | ||||||||||
| Domestic | 39.8 | 23.0 | 17.7 | 17.1 | 8.5 | 9.3 | 7.8 | 5.5 | 5.5 | 8 |
| Other | 10.3 | 5.2 | 5.0 | 4.6 | 3.1 | 2.4 | 2.2 | 1.7 | 1.8 | 3 |
| Combustion in Industry | ||||||||||
| Iron & Steel | 10.5 | 6.8 | 3.7 | 4.5 | 5.3 | 5.0 | 5.1 | 5.3 | 5.6 | 9 |
| Other Combustion in Industry | 42.1 | 20.7 | 16.1 | 12.9 | 12.3 | 13.3 | 11.5 | 9.5 | 7.2 | 11 |
| Non-ferrous Metals | 5.1 | 4.3 | 4.6 | 4.2 | 4.2 | 3.2 | 3.0 | 2.8 | 3.0 | 5 |
| Cement | 0.0 | 0.0 | 0.0 | 0.0 | 0.0 | 0.0 | 0.0 | 0.0 | 0.0 | 0 |
| Glass production | 1.5 | 1.7 | 1.7 | 1.6 | 1.8 | 1.7 | 1.7 | 1.7 | 1.7 | 3 |
| Production Processes | ||||||||||
| Processes in Industry | 0.0 | 0.0 | 0.0 | 0.0 | 0.0 | 0.0 | 0.0 | 0.0 | 0.0 | 0 |
| Iron & Steel | 15.0 | 12.5 | 8.4 | 10.5 | 11.5 | 9.4 | 9.2 | 9.0 | 9.1 | 14 |
| Extr./Distrib. of Fossil Fuels | 0.0 | 0.0 | 0.0 | 0.0 | 0.0 | 0.0 | 0.0 | 0.0 | 0.0 | 0 |
| Road Transport | 0.3 | 0.4 | 0.4 | 0.5 | 0.6 | 0.6 | 0.6 | 0.6 | 0.6 | 1 |
| Other Transp & Mach. | 0.1 | 0.1 | 0.0 | 0.0 | 0.0 | 0.0 | 0.0 | 0.0 | 0.0 | 0 |
| Waste Treatment & Disp. | 19.7 | 19.7 | 19.7 | 19.8 | 16.7 | 14.9 | 11.7 | 9.0 | 5.9 | 9 |
| Total | 194.3 | 141.3 | 131.0 | 119.3 | 114.8 | 99.7 | 88.6 | 75.3 | 64.6 | 100 |
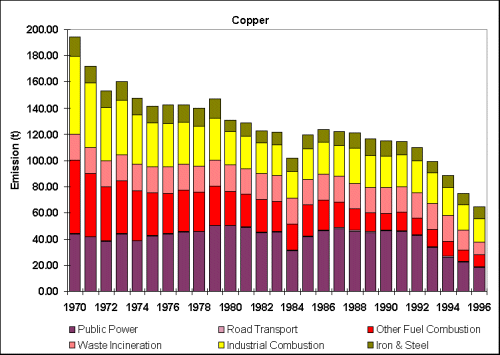
Table 6.12 and Figure 6.5 summarise the UK emissions of lead. Emissions have declined by 82% since 1970. The main source is still from anti-knock lead additives in petrol and it is here where the most significant reductions have been made. The lead content of leaded petrol was reduced from around 0.34 g/l to 0.143 g/l in 1986 and since 1987 sales of unleaded petrol have increased particularly as a result of the increased use of cars fitted with catalytic converters. Other major sources are non-ferrous metal production and iron and steel processes where there has been some reduction in emissions due to improved abatement measures. Emissions have also declined as a result of the decreasing use of coal. The estimates for coal fired power stations have been revised upwards based on new data from the major power generators. The effect of stricter controls on waste incineration emissions are apparent from 1995 onwards.
| 1970 | 1975 | 1980 | 1985 | 1990 | 1993 | 1994 | 1995 | 1996 | 1996% | |
| By UNECE Category | ||||||||||
| Comb in Energy Prod & Trans | 96 | 90 | 96 | 80 | 107 | 86 | 103 | 83 | 71 | 5 |
| Comb in Comm/Inst/Res/Agri | ||||||||||
| Domestic | 126 | 73 | 56 | 54 | 27 | 29 | 25 | 17 | 17 | 1 |
| Other | 31 | 15 | 14 | 13 | 9 | 7 | 6 | 5 | 5 | 0 |
| Combustion in Industry | ||||||||||
| Iron & Steel | 30 | 19 | 11 | 12 | 14 | 13 | 13 | 13 | 12 | 1 |
| Other Combustion in Industry | 117 | 53 | 42 | 37 | 35 | 38 | 33 | 28 | 21 | 2 |
| Non-ferrous Metals | 204 | 172 | 204 | 203 | 205 | 209 | 199 | 178 | 189 | 14 |
| Cement | 9 | 9 | 8 | 7 | 8 | 6 | 7 | 7 | 6 | 0 |
| Glass production | 14 | 15 | 15 | 14 | 15 | 15 | 15 | 15 | 14 | 1 |
| Production Processes | ||||||||||
| Processes in Industry | 4 | 6 | 3 | 4 | 1 | 1 | 2 | 2 | 2 | 0 |
| Iron & Steel | 123 | 124 | 99 | 104 | 108 | 78 | 73 | 67 | 64 | 5 |
| Extr./Distrib. of Fossil Fuels | 0 | 0 | 0 | 0 | 0 | 0 | 0 | 0 | 0 | 0 |
| Road Transport | 6201 | 7153 | 7314 | 6411 | 2149 | 1507 | 1272 | 1046 | 894 | 66 |
| Other Transp & Mach. | 257 | 239 | 195 | 145 | 37 | 28 | 24 | 19 | 17 | 1 |
| Waste Treatment & Disp. | 149 | 149 | 149 | 149 | 127 | 113 | 90 | 63 | 45 | 3 |
| Total | 7363 | 8117 | 8206 | 7234 | 2842 | 2129 | 1860 | 1541 | 1357 | 100 |

Table 6.13 and Figure 6.6 summarise the UK emissions of mercury. Emissions have declined by 63% since 1970. The main sources are waste incineration, the manufacture of chlorine in mercury cells, non-ferrous metal production and coal combustion. Emissions have declined as a result of improved controls on mercury cells and their replacement by diaphragm cells and the decline of coal use. The impact of recent controls on waste incineration emissions are apparent from 1995 onwards. The emissions from coal fired power stations have been increased two fold based on new data from the major power generators (Quick, 1998).
| 1970 | 1975 | 1980 | 1985 | 1990 | 1993 | 1994 | 1995 | 1996 | 1996% | |
| By UNECE Category | ||||||||||
| Comb in Energy Prod & Trans | 8.0 | 7.6 | 8.3 | 7.1 | 8.4 | 6.2 | 6.7 | 5.9 | 5.0 | 31 |
| Comb in Comm/Inst/Res/Agri | ||||||||||
| Domestic | 5.2 | 3.0 | 2.3 | 2.3 | 1.2 | 1.3 | 1.1 | 0.8 | 0.8 | 5 |
| Other | 1.1 | 0.5 | 0.5 | 0.5 | 0.3 | 0.2 | 0.2 | 0.1 | 0.2 | 1 |
| Combustion in Industry | ||||||||||
| Iron & Steel | 0.9 | 0.6 | 0.4 | 0.3 | 0.3 | 0.3 | 0.3 | 0.3 | 0.3 | 2 |
| Other Combustion in Industry | 4.2 | 1.8 | 1.4 | 1.4 | 1.4 | 1.5 | 1.3 | 1.1 | 0.8 | 5 |
| Non-ferrous Metals | 2.1 | 1.8 | 1.7 | 2.3 | 2.4 | 3.2 | 2.9 | 2.3 | 2.6 | 16 |
| Cement | 0.2 | 0.2 | 0.2 | 0.1 | 0.2 | 0.1 | 0.1 | 0.1 | 0.1 | 1 |
| Glass production | 0.1 | 0.1 | 0.1 | 0.1 | 0.2 | 0.1 | 0.1 | 0.1 | 0.1 | 1 |
| Production Processes | ||||||||||
| Processes in Industry | 13.3 | 13.3 | 12.1 | 9.7 | 7.9 | 3.1 | 3.4 | 4.0 | 2.2 | 14 |
| Iron & Steel | 1.5 | 1.3 | 1.0 | 1.0 | 1.0 | 0.9 | 0.9 | 1.0 | 0.9 | 6 |
| Extr./Distrib. of Fossil Fuels | 0.0 | 0.0 | 0.0 | 0.0 | 0.0 | 0.0 | 0.0 | 0.0 | 0.0 | 0 |
| Road Transport | 0.0 | 0.0 | 0.0 | 0.0 | 0.0 | 0.0 | 0.0 | 0.0 | 0.0 | 0 |
| Other Transp & Mach. | 0.0 | 0.0 | 0.0 | 0.0 | 0.0 | 0.0 | 0.0 | 0.0 | 0.0 | 0 |
| Waste Treatment & Disp. | 7.3 | 7.6 | 7.6 | 7.6 | 6.7 | 6.2 | 5.3 | 4.3 | 3.2 | 20 |
| Total | 44.0 | 38.0 | 35.6 | 32.3 | 30.0 | 23.2 | 22.4 | 20.1 | 16.2 | 100 |
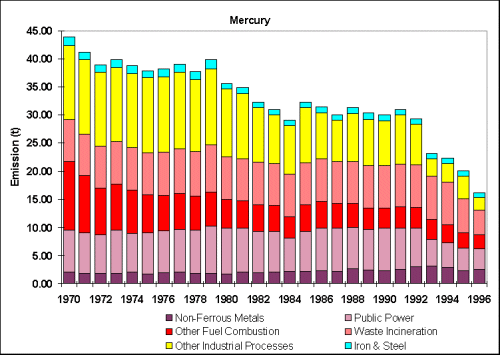
Table 6.14 and Figure 6.7 summarise the UK emissions of nickel. Emissions have declined by 76% since 1970. The main sources of nickel emissions are the combustion of coal and heavy fuel oil. These have declined in use since 1970 in favour of natural gas and are largely responsible for the reduction in total emissions. Since 1989 heavy fuel oil has been replaced by orimulsion (an emulsion of bitumen in water) in some power stations though this has now been discontinued. The nickel content of orimulsion was higher than that of heavy fuel oil and resulted in higher emissions in spite of the flue gas cleaning equipment required on these power stations. Emissions from power stations have been revised downwards by a factor of two since the previous inventory based on new data from the major power generators (Quick, 1998).
| 1970 | 1975 | 1980 | 1985 | 1990 | 1993 | 1994 | 1995 | 1996 | 1996% | |
| By UNECE Category | ||||||||||
| Comb in Energy Prod & Trans | 263 | 258 | 214 | 185 | 160 | 162 | 147 | 137 | 128 | 44 |
| Comb in Comm/Inst/Res/Agri | ||||||||||
| Domestic | 126 | 71 | 55 | 53 | 26 | 28 | 24 | 17 | 16 | 6 |
| Other | 105 | 67 | 83 | 69 | 42 | 45 | 45 | 37 | 35 | 12 |
| Combustion in Industry | ||||||||||
| Iron & Steel | 45 | 24 | 11 | 5 | 6 | 7 | 7 | 7 | 7 | 2 |
| Other Combustion in Industry | 646 | 485 | 356 | 176 | 162 | 173 | 154 | 113 | 92 | 31 |
| Non-ferrous Metals | 0 | 0 | 0 | 0 | 0 | 0 | 0 | 0 | 0 | 0 |
| Cement | 2 | 2 | 2 | 1 | 1 | 1 | 1 | 1 | 1 | 0 |
| Glass production | 5 | 5 | 6 | 5 | 6 | 5 | 5 | 5 | 5 | 2 |
| Production Processes | ||||||||||
| Processes in Industry | 0 | 3 | 4 | 3 | 3 | 2 | 2 | 2 | 2 | 1 |
| Iron & Steel | 7 | 6 | 4 | 5 | 5 | 4 | 4 | 4 | 4 | 1 |
| Extr./Distrib. of Fossil Fuels | 0 | 0 | 0 | 0 | 0 | 0 | 0 | 0 | 0 | 0 |
| Road Transport | 1 | 1 | 1 | 1 | 1 | 1 | 1 | 1 | 0 | 0 |
| Other Transp & Mach. | 0 | 0 | 0 | 0 | 0 | 0 | 0 | 0 | 0 | 0 |
| Waste Treatment & Disp. | 8 | 8 | 8 | 8 | 7 | 6 | 4 | 3 | 1 | 1 |
| Total | 1207 | 931 | 744 | 512 | 420 | 436 | 396 | 329 | 292 | 100 |
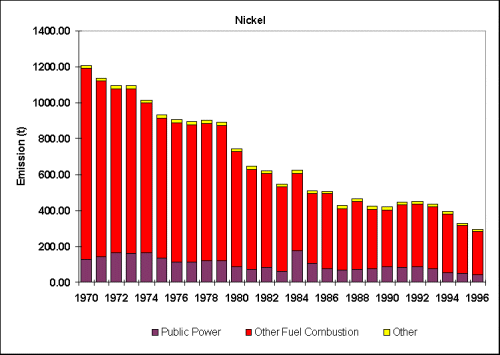
Table 6.15 and Figure 6.8 summarise the UK emissions of selenium. Emissions have declined by 49% since 1970. The main source of selenium emissions is coal combustion. Only trace amounts are emitted by the combustion of petroleum based fuels. Emissions have reduced over the period considered because of the decline in coal use in favour of natural gas combustion. The other important source is glass manufacture, though this estimate is uncertain because it is based on very limited data. Emissions from power stations have been revised downwards slightly since the previous inventory based on new data from the major power generators (Quick, 1998).
| 1970 | 1975 | 1980 | 1985 | 1990 | 1993 | 1994 | 1995 | 1996 | 1996% | |
| By UNECE Category | ||||||||||
| Comb in Energy Prod & Trans | 54.4 | 51.8 | 59.9 | 49.3 | 54.0 | 39.7 | 31.1 | 27.1 | 22.4 | 27 |
| Comb in Comm/Inst/Res/Agri | ||||||||||
| Domestic | 25.6 | 14.7 | 11.4 | 11.0 | 5.4 | 5.9 | 4.9 | 3.4 | 3.4 | 4 |
| Other | 6.6 | 3.4 | 3.4 | 3.1 | 2.1 | 1.7 | 1.5 | 1.2 | 1.2 | 1 |
| Combustion in Industry | ||||||||||
| Iron & Steel | 2.0 | 1.0 | 0.5 | 0.4 | 0.4 | 0.4 | 0.4 | 0.5 | 0.5 | 1 |
| Other Combustion in Industry | 28.5 | 14.6 | 11.3 | 8.7 | 8.4 | 9.0 | 7.8 | 6.4 | 4.9 | 6 |
| Non-ferrous Metals | 0.0 | 0.0 | 0.0 | 0.0 | 0.0 | 0.0 | 0.0 | 0.0 | 0.0 | 0 |
| Cement | 0.0 | 0.0 | 0.0 | 0.0 | 0.0 | 0.0 | 0.0 | 0.0 | 0.0 | 0 |
| Glass production | 45.2 | 49.6 | 52.2 | 46.8 | 54.4 | 50.6 | 51.2 | 50.7 | 49.7 | 60 |
| Production Processes | ||||||||||
| Processes in Industry | 0.0 | 0.0 | 0.0 | 0.0 | 0.0 | 0.0 | 0.0 | 0.0 | 0.0 | 0 |
| Iron & Steel | 0.5 | 0.5 | 0.3 | 0.4 | 0.4 | 0.4 | 0.4 | 0.4 | 0.4 | 0 |
| Extr./Distrib. of Fossil Fuels | 0.0 | 0.0 | 0.0 | 0.0 | 0.0 | 0.0 | 0.0 | 0.0 | 0.0 | 0 |
| Road Transport | 0.2 | 0.2 | 0.2 | 0.3 | 0.3 | 0.4 | 0.4 | 0.4 | 0.4 | 0 |
| Other Transp & Mach. | 0.0 | 0.0 | 0.0 | 0.0 | 0.0 | 0.0 | 0.0 | 0.0 | 0.0 | 0 |
| Waste Treatment & Disp. | 0.2 | 0.2 | 0.2 | 0.2 | 0.1 | 0.1 | 0.1 | 0.1 | 0.0 | 0 |
| Total | 163.3 | 136.0 | 139.4 | 120.0 | 125.5 | 108.1 | 97.9 | 90.2 | 83.0 | 100 |

Table 6.16 and Figure 6.9 summarise the UK emissions of vanadium. Emission data is rather scarce so the estimates are very uncertain. Emissions have declined by 76% since 1970. The major source of emissions is the combustion of fuel oils. This accounted for around 93% of the estimated emission in 1996. The reduction in emissions reflects the decline in the use of fuel oils by the electricity supply industry and other industry. Since 1989, heavy fuel oil has been partly replaced by orimulsion (an emulsion of bitumen in water) in some power stations though this has now been discontinued. The vanadium content of orimulsion was higher than that of heavy fuel oil and resulted in higher emissions in spite of the flue gas cleaning equipment required on these power stations. Emissions from power stations have been revised downwards by 63% since the previous inventory based on new data from the major power generators (Quick, 1998). The other significant source is the iron and steel industry. These estimates are very uncertain since emissions will depend on the type of steel or alloy produced and its vanadium content, but the available emissions data apply only to a generalised steel production process.
| 1970 | 1975 | 1980 | 1985 | 1990 | 1993 | 1994 | 1995 | 1996 | 1996% | |
| By UNECE Category | ||||||||||
| Comb in Energy Prod & Trans | ||||||||||
| Public Power | 366 | 393 | 216 | 297 | 226 | 233 | 174 | 170 | 139 | 11 |
| Petroleum Refining Plants | 668 | 632 | 660 | 417 | 382 | 451 | 469 | 439 | 440 | 36 |
| Other Comb. & Trans. | 12 | 7 | 4 | 2 | 1 | 0 | 0 | 0 | 0 | 0 |
| Comb in Comm/Inst/Res/Agri | ||||||||||
| Domestic | 147 | 77 | 62 | 56 | 27 | 28 | 25 | 18 | 16 | 1 |
| Other | 447 | 301 | 394 | 319 | 191 | 218 | 220 | 185 | 171 | 14 |
| Combustion in Industry | ||||||||||
| Iron & Steel | 208 | 118 | 52 | 24 | 29 | 34 | 34 | 34 | 29 | 2 |
| Other Combustion in Industry | 3016 | 2416 | 1764 | 804 | 733 | 781 | 701 | 497 | 411 | 33 |
| Non-ferrous Metals | 0 | 0 | 0 | 0 | 0 | 0 | 0 | 0 | 0 | 0 |
| Cement | 0 | 0 | 0 | 0 | 0 | 0 | 0 | 0 | 0 | 0 |
| Glass production | 21 | 23 | 24 | 22 | 25 | 24 | 24 | 24 | 23 | 2 |
| Production Processes | ||||||||||
| Processes in Industry | 0 | 0 | 0 | 0 | 0 | 0 | 0 | 0 | 0 | 0 |
| Iron & Steel | 8 | 5 | 3 | 5 | 6 | 5 | 5 | 5 | 6 | 0 |
| Extr./Distrib. of Fossil Fuels | 0 | 0 | 0 | 0 | 0 | 0 | 0 | 0 | 0 | 0 |
| Road Transport | 0 | 0 | 0 | 0 | 1 | 1 | 1 | 1 | 1 | 0 |
| Other Transp & Mach. | 0 | 0 | 0 | 0 | 0 | 0 | 0 | 0 | 0 | 0 |
| Waste Treatment & Disp. | 0 | 0 | 0 | 0 | 0 | 0 | 0 | 0 | 0 | 0 |
| Total | 4892 | 3973 | 3180 | 1947 | 1620 | 1775 | 1652 | 1373 | 1235 | 100 |
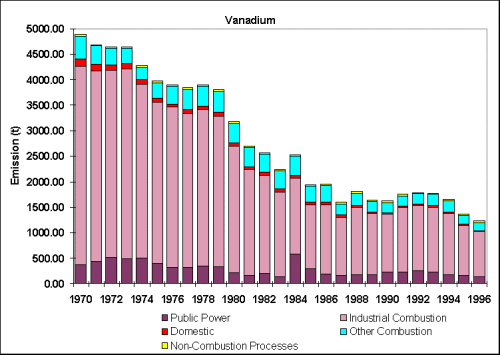
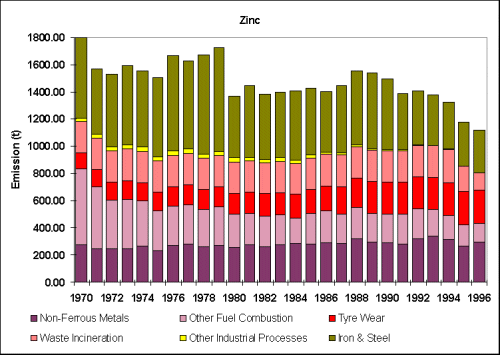
Table 6.17 and Figure 6.10 summarise the UK emissions of zinc. Emissions of zinc have declined by 38% since 1970. The main sources are iron and steel production, non-ferrous metals manufacture, road transport, waste incineration and coal combustion. The road transport emission is almost entirely due to Tyre wear. The reduction in emissions over the period considered is largely due to the decline in coal combustion and improvements in abatement measures in the iron and steel industry. Improvements in waste incineration emissions due to stricter controls are apparent from 1995 onwards. The apparent increase in emissions in Energy Production and Transformation since 1970 is due to a large contribution from electricity generation from waste from 1990 onwards.
| 1970 | 1975 | 1980 | 1985 | 1990 | 1993 | 1994 | 1995 | 1996 | 1996% | |
| By UNECE Category | ||||||||||
| Comb in Energy Prod & Trans | 65 | 50 | 44 | 32 | 68 | 81 | 125 | 100 | 80 | 7 |
| Comb in Comm/Inst/Res/Agri | ||||||||||
| Domestic | 27 | 17 | 13 | 13 | 7 | 8 | 7 | 5 | 5 | 0 |
| Other | 81 | 39 | 36 | 34 | 24 | 17 | 15 | 11 | 12 | 1 |
| Combustion in Industry | ||||||||||
| Iron & Steel | 37 | 21 | 12 | 12 | 14 | 13 | 13 | 14 | 15 | 1 |
| Other Combustion in Industry | 311 | 129 | 103 | 98 | 96 | 104 | 89 | 76 | 57 | 5 |
| Non-ferrous Metals | 277 | 233 | 256 | 284 | 292 | 340 | 317 | 266 | 295 | 26 |
| Cement | 5 | 5 | 4 | 4 | 4 | 3 | 3 | 3 | 3 | 0 |
| Glass production | 28 | 30 | 32 | 29 | 33 | 31 | 31 | 31 | 30 | 3 |
| Production Processes | ||||||||||
| Processes in Industry | 25 | 27 | 31 | 24 | 11 | 3 | 4 | 3 | 3 | 0 |
| Iron & Steel | 594 | 579 | 454 | 488 | 513 | 374 | 349 | 323 | 314 | 28 |
| Extr./Distrib. of Fossil Fuels | 0 | 0 | 0 | 0 | 0 | 0 | 0 | 0 | 0 | 0 |
| Road Transport | 120 | 140 | 156 | 177 | 235 | 236 | 242 | 247 | 249 | 22 |
| Other Transp & Mach. | 0 | 0 | 0 | 0 | 0 | 0 | 0 | 0 | 0 | 0 |
| Waste Treatment & Disp. | 230 | 230 | 231 | 231 | 194 | 172 | 134 | 98 | 56 | 5 |
| Total | 1800 | 1501 | 1371 | 1425 | 1491 | 1381 | 1328 | 1177 | 1119 | 100 |