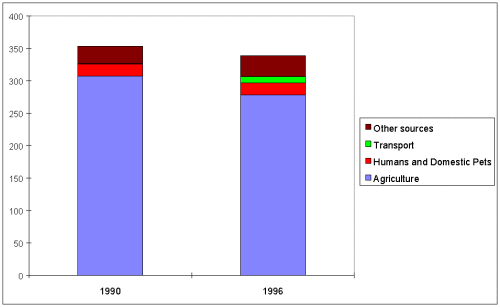

The most recent inventory of the UK emissions of ammonia is shown in Table 5.7. The inventory is based on a working group on ammonia emissions comprising DOE, MAFF, Silsoe Research Institute, Institute of Grassland and Environmental Research, Imperial College, AEA Technology and Institute of Terrestrial Ecology.
| 1990 | 1996 | 1990 | 1996 | |
| As N | As N | As NH3 | As NH3 | |
| Agricultural | ||||
| Cattle | 129.51 | 125.8 | 157 | 153 |
| Sheep | 13.21 | 13.4 | 16 | 16 |
| Pigs | 26.43 | 25.66 | 32 | 31 |
| Poultry | 42.38 | 44.2 | 51 | 54 |
| Cons. Grass | 19.33 | 9.77 | 23 | 12 |
| Tillage | 21.77 | 10.08 | 26 | 12 |
| Deer | 0.04 | 0.03 | 0 | 0 |
| Total Agri. | 252.67 | 228.94 | 307 | 278 |
| Non Agricultural | ||||
| Agro. Chem | 1.6 1 | 1.6 | ||
| Human | 3 1 | 3 | ||
| Horses | 7 1 | 7 | ||
| Dogs | 7.6 1 | 7.6 | ||
| Cats | 1.1 1 | 1.1 | ||
| Land Spreading | 11.3 2 | 17 | ||
| Sewage Works | 1.5 1 | 1.5 | ||
| Landfill | 4 1 | 4 | ||
| Transport | 0.81 3 | 10 | ||
| Coal Comb. | 4.3 1 | 4.3 | ||
| Waste Incin. | 0.9 1 | 0.9 | ||
| Biomass Burning | 2 1 | 2 | ||
| Natural Soils | 0 1 | 0 | ||
| Wild Animals & Birds | 1 1 | 1 | ||
| Total non-agricultural | 46 | 61 | ||
| Total UK | 353 | 339 |
Ammonia emissions are dominated by agricultural sources with emissions from livestock and their wastes comprising 82% of the total emission. These emissions derive mainly from the decomposition of urea in animal wastes and uric acid in poultry wastes. Emissions depend on animal species, age, weight, diet, housing systems, waste management and storage techniques . Hence emissions are affected by a large number of factors which make the interpretation of experimental data difficult and emission estimates uncertain (DOE, 1994). The other agricultural sources included are emissions from fertiliser use, crops and decomposition of agricultural vegetation. These are particularly uncertain owing to the complexity of the processes involved. The category non-agricultural sources comprises a number of diverse sources. The total emission from these sources is estimated as around 18% of the total, however these are very uncertain due to a lack of data. Emissions of ammonia from road transport although relatively small are increasing as a result of the uptake of three way catalysts.

Due to the complex nature of estimating inventories, a simple quantitative treatment can not be given for the accuracy of emission estimates. However, an indication can be made of the systematic errors in a qualitative way for each pollutant.
The SO2 emissions are likely to be the most accurate as they depend largely on the level of sulphur in fuels and hence a comprehensive analysis of coal and fuel oil consumption by power stations and the agriculture, industry and domestic sectors. The totals are likely to be within an accuracy of +/- 10-15% of the true figure. Margins of error result mainly from the uncertainties about sulphur retention in ash.
NOx emissions are less accurate than SO2 because they are based on relatively few measurements of emission factors and depend on combustion conditions that can vary widely. For example, the amount of NOx emitted from vehicles varies as a function of speed as well as being dependent on the type of vehicle. In addition, many of the data used have been derived from other small samples which contain margins of error e.g. vehicle speed distributions. It is estimated that NOx emissions are accurate to +/-30%.
The development of an accurate emission inventory for NMVOCs is hindered by a number of factors. First, the number of species covered by the term NMVOCs is very large and they arise from a diverse range of processes. Within a single industry sector such as printing, the variation in the quantity and composition of organic solvents used in the inks, the different printing processes used and the varying extent and types of abatement used on the different presses make it difficult to apply a single, generally valid, emission factor across the industry. The cost of measuring emission factors for all of the different processes would be very high and not entirely satisfactory since the measurement of emission factors is also problematic. Many commonly employed measurement techniques such as flame ionisation detection do not respond with uniform sensitivity to all compounds. Large errors can therefore occur if emitted compounds are poorly detected by the measurement technique used. Methane is also associated with NMVOC emissions from many sources, for instance, combustion processes, transport, and the oil and gas industries. Emission factors derived from measurements of these sources will often include a methane component. In addition data relating to individual industrial processes and solvent use are incomplete. Overall, it is concluded that the accuracy of non-methane VOC emissions are subject to a wide margin of error and it is estimated that UK emissions are probably accurate to +/- 50%
Ammonia emissions are the most uncertain due largely to the nature of the major agricultural sources. Emissions depend on animal species, age, weight, diet, housing systems, waste management and storage techniques. Hence emissions are affected by a large number of factors which make the interpretation of experimental data difficult and emission estimates uncertain (DOE, 1994).