Where pollution is measured
The map to the right (Fig. 1) shows the locations of the 108 automatic monitoring sites in the UK national networks (January 1999).

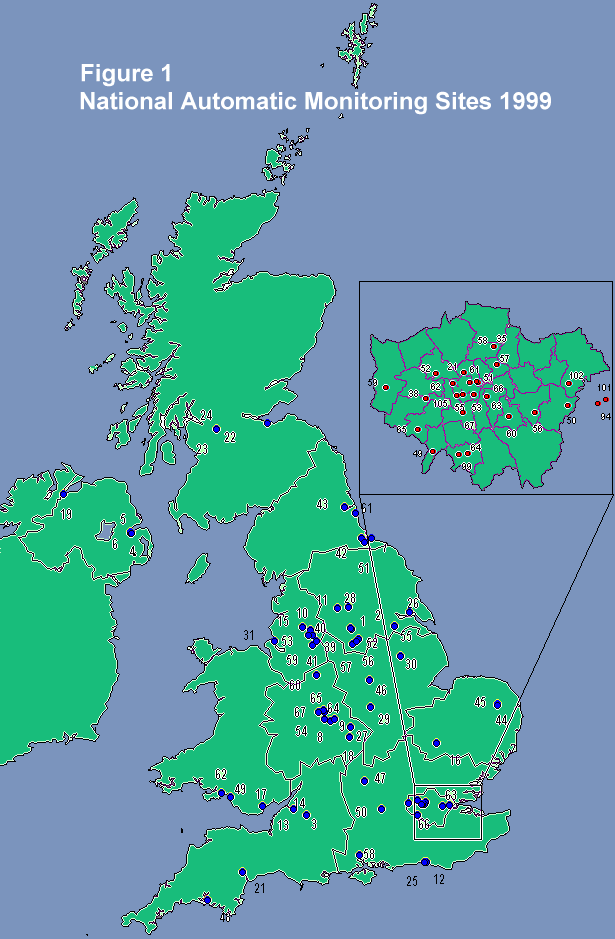
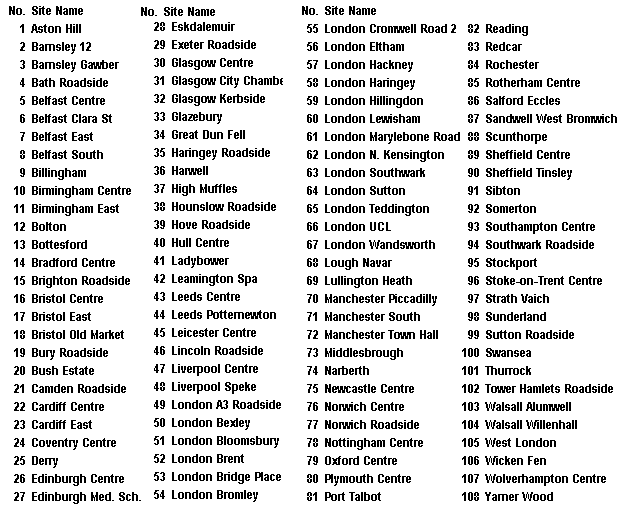
A central unit collects the data from these sites every hour, and then checks and stores it for further analysis. The number of sites has expanded considerably over the last 2-3 years, as local authority sites affiliate to the network and also as more directly funded sites have been established. Details of the pollutants measured are shown with the map.

A range of pollutants are measured across the country. Any given site may measure different species, depending on its location and monitoring objectives. Sites are set up to assess the air quality in areas of high population, or in rural areas to assess the impact of pollution carried long distances.


You can access up-to-date hourly data from all automatic sites, together with an air pollution forecast by Ceefax (pages 410 - 417), Teletext (page106), and a freephone telephone service (0800 556677). Air pollution information is also available via the Internet - the Air Pollution Information pages on the World Wide Web contain the latest hours measurements from all sites, as well as a forecast of air pollution for the next 24 hours and background information about air pollution issues.

Air pollution levels are described in four bands, based on health effects, as 'low', 'moderate', 'high' and 'very high' levels of pollution. A separate leaflet has been produced on the banding system and health effects - "Air Pollution - what it means for your health" - which is available from the contact addresses given on the back cover of this brochure.

All of the historic data from the networks is also available on the World Wide Web via the National Air Quality Information Archive, together with comprehensive information about emissions into the atmosphere from the National Atmospheric Emissions Inventory. The Archive is also available on CD. Details of how to access all of these sources of information are given in the last section of this brochure.

Pollutant Number of sites
(Jan 1999)
Site type
Ozone 71 19 in rural areas,
the rest in urban areas
Oxides of nitrogen 85 Mostly in urban areas,
9 in rural areas
Sulphur dioxide 66 Mostly in urban areas,
8 in rural areas
Carbon monoxide 61 All in urban areas
Particles (as PM10) 50 Mostly in urban areas,
3 in rural areas
Hydrocarbons,
including benzene and
1,3 butadiene.
13 12 in urban areas,
1 rural site

Air pollution is also measured in the UK by a variety of simpler methods. These use non-automatic sampling techniques to measure lead and other heavy metals, acid rain, ammonia, black smoke and sulphur dioxide, nitrogen dioxide and some toxic organic compounds. At present, there are over 1500 of these sampler sites across the country, providing much information on geographical patterns of pollution and supplementing the high-resolution data from automatic networks. Maps of these networks are shown in Figs 2 - 4.

The species measured at the largest number of sampler sites are nitrogen dioxide, measured by the Nitrogen Dioxide Survey, and black smoke and sulphur dioxide, measured by a long-running network established in the 1960's.

The Nitrogen Dioxide Survey was established in 1993 to measure nitrogen dioxide concentrations in towns and cities throughout the UK. It is the first survey of its kind in the world to monitor air pollutants in this way over such a large scale. The main aims of the survey are:


The survey monitored at 1254 locations in 331 Local Authorities throughout the UK, in 1997, and depends on the co-operation and assistance of these authorities for its success.

The Black Smoke and Sulphur Dioxide network has been operated for 35 years, and is probably the longest-running network of its type in the world. The network was first established under the Clean Air Act, in response to the London smogs of the 1950's. There are currently about 220 sites in the network, all situated in urban areas, and operated by Local Authorities.
LINKS TO:
Rural Sulphur Dioxide and
Toxic Organic Micropollutants Network
Figure 2
Black Smoke/Sulphur Dioxide and
Lead/Multi-Element Networks
Figure 3
Nitrogen Dioxide
Diffusion Tube Survey
Figure 4

back contents next

Site prepared by the National Environmental Technology Centre, part of AEA Technology, on behalf of the UK Department of the Environment, Transport and the Regions