|
Carbon Monoxide
Carbon monoxide (CO) is a pollutant gas generated by combustion sources. At very high concentrations (such as may occur inside a building with a faulty heating appliance), it can be a dangerous asphyxiant. Whilst outdoor concentrations do not generally reach dangerous levels, they may still have adverse health effects for vulnerable people. CO is a component of vehicle emissions, and the highest outdoor concentrations occur near busy roads. In this report, concentrations of carbon monoxide are expressed as milligrammes (i.e. 10-3 grammes) per cubic metre (mgm-3). To convert to parts per million, if necessary, the following relationship should be used: 1 ppm = 1.16 mgm-3 for carbon monoxide at 293K
(20°C)
and 1013mb. CO is monitored at two sites in Northern Ireland. They are part of the Automatic Urban Network (AUN) and use the Non-Dispersive Infra Red (NDIR) continuous monitoring technique. The sites are listed in Table 3.1, and shown in Figure 3.1. Table 3.1 CO
Monitoring Sites
The World Health Organisation has established non-mandatory air quality guidelines for carbon monoxide. Within the European Community, CO is covered by EC Directive 2000/69/EC (the 2nd Daughter Directive). In the UK, the Air Quality Strategy contains an objective for CO, to be met by 31st December 2003. Table 3.2 Limit
Values and Objectives for Carbon Monoxide
The results from the CO measuring sites are shown in Table 3.3 below. Annual data capture is at least 75% except where indicated. Table 3.3 Results
from Automatic CO Monitoring Sites
a)
Limited data capture: Belfast Centre 2001 (60%) b)
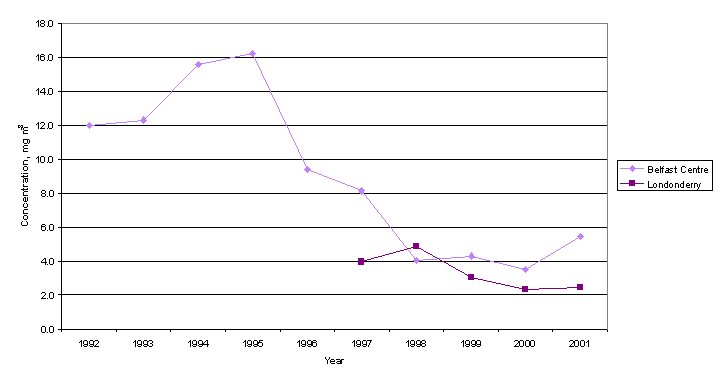
Limited data capture Londonderry 1997 (60%) Both sites currently meet the EC 2nd Daughter Directive limit value and the Air Quality Strategy objective for this pollutant, with maximum daily running 8-hour mean below 10 mg m-3 since 1996. Figure 3.2 illustrates the falling trend in maximum 8-hour running mean CO concentration for the two sites. Peak CO concentrations at Belfast Centre have decreased since the mid 1990s. However, both sites showed a slight increase in 2001 compared to the previous year.
Figure 3.2 Maximum
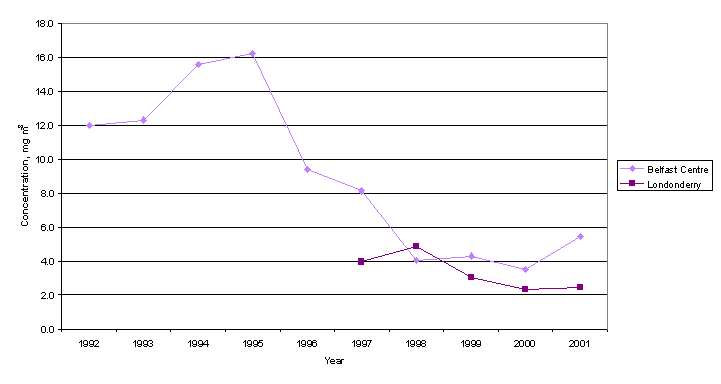
Running 8-hour Mean CO Concentration Trends are often shown more clearly by statistics based on longer periods, such as the annual mean. Figure 3.3 shows how the annual mean CO concentrations at the same sites have decreased since the early and mid 1990s but remained stable in recent years. Based on a regression analysis (Theil’s non-parametric regression analysis), there is a significant downward trend in the annual mean carbon monoxide at Belfast Centre but not at Londonderry. However, despite the overall downward trend at Belfast Centre, it should be noted that annual mean carbon monoxide appears to have remained stable for the past four years. Annual mean CO concentrations for 2001 showed slight increases on the 2000 values at both sites. Future years’ monitoring will be important, to establish whether or not the downward trend resumes.
Figure 3.3 Annual
Mean CO Concentrations at Automatic Monitoring Sites (data capture at
least 75%) Emission inventory data for the UK (although not for
Northern Ireland alone) are available from the National Atmospheric Emissions
Inventory (NAEI), on the World Wide Web at www.naei.org.uk.
Total UK emissions of carbon monoxide have reduced by 37% between 1992 and
2000, and the downward emission trend shows no sign of flattening off in recent
years. An emission inventory study of Greater Belfast2, based on
1997 data, calculated that around 23% of Belfast’s CO emissions arise from
domestic combustion; a much larger proportion than in other UK cities (for
example around 10% in Swansea and Port Talbot3, and less than 2% in
Merseyside, Bristol and Southampton3) However, Belfast’s total CO
emissions are still dominated by road traffic (75%), and total UK emissions
from this source are decreasing. | ||||||||||||||||||||||||||||||||||||||||||||||||||||||||||||||||||||||||||||||||||||||||||||||||||||||||||||||||||||||||||||||||||||||||||||||


