Greenhouse Gas Emissions
Introduction
Increasing atmospheric concentrations of greenhouse gases (GHGs) originating from anthropogenic activities are leading to enhanced warming of the atmosphere and global climate change. The major greenhouse gases are carbon dioxide (CO2), methane (CH4) and nitrous oxide (N2O) all of which have both natural and anthropogenic sources. In contrast, the three industrial gases: hydrofluorocarbons (HFC), perfluorocarbons (PFC) and sulphur hexafluoride (SF6), are potent greenhouse gases but do not occur in nature, and hence only originate from anthropogenic sources.
These six greenhouse gases comprise the ‘basket of emissions’ against which reduction targets were agreed at the Third Conference of the Parties of the United Nations Framework Convention on Climate Change in Kyoto, Japan in December 1997. The target for the UK is to achieve a reduction of the global warming potential of the six greenhouse gases of 12.5% by 2008-2012 (based on 1990 emissions estimates). Consequently the UK is required to compile annual emission inventories of these greenhouse gases and report the emissions to international bodies, to demonstrate compliance with this legislation. The UK Greenhouse Gas Inventory is submitted to UNFCCC in the Common Reporting Format (CRF). The Common Reporting Format gives net carbon emissions, that is emissions minus removals. The data in this report is presented here in a UN/ECE reporting format (see Annex 1) and quotes land use change and forestry emissions and removals separately. More detailed information may be found in the annual report on UK GHG emissions produced by the NAEI (Salway et al, 2002).
The 2000 emissions for each of these six greenhouse gases are summarised in Table 2.1, and their inventories are discussed in the following sections. Inventories for the three indirect greenhouse gases (carbon monoxide, nitrogen oxides and non-methane volatile organic compounds) are included in subsequent chapters (Chapters 4, 5 and 5 respectively).
The total global warming potential of UK greenhouse gas emissions has been calculated using their global warming potentials (GWPs), which measures their effectiveness in global warming relative to CO2, agreed by IPCC for a 100 year time horizon (IPCC, 1996).
Table 2.1 GWP for UK Emissions of Greenhouse Gases in 2000
|
Direct GHG |
Emissions (kt) |
GWP (100 years) |
Global Warming Equivalence
|
|
CO2 |
147,532 |
1 |
540,951 |
|
CH4 |
2,427 |
21 |
50,960 |
|
N2O |
141 |
310 |
43,813 |
|
HFCs |
3.4 |
560-121002 |
9,316 |
|
PFCs |
0.097 |
6000-74002 |
668 |
|
SF6 |
64.4 |
23900 |
1,540 |
1 Calculated on
IPCC basis and includes land-use change emissions. CO2 includes
emissions only and does not include land use change and forestry removals
2 Range
of GWP for species used
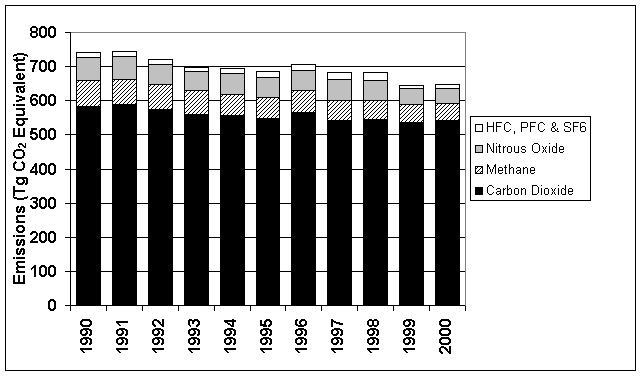
During the period 1990-2000 there has been a decrease in UK emissions of CO2, CH4, N2O, HFC and PFC but considerable increases in SF6 emissions. The overall effect has been a decrease in global warming potential from UK emissions. Figure 2.1 shows greenhouse gas emissions (comprising CO2 , CH4 , N2O , HFCs, PFCs and SF6) as CO2 equivalent for 1990 to 2000. Reliable emission estimates of HFCs, PFCs, SF6 and N2O (from adipic acid production) are not available prior to 1990.
Figure 2.1 Total Global Warming Potential Associated with UK Emissions of GHGs
CO2 is the major contributor to greenhouse gas emissions in the UK and arises predominately from the combustion of fossil fuels. Non-fossil fuel sources are more difficult to assess due to the importance of CO2 in respiratory processes and its role within the global carbon cycle. Following internationally agreed conventions, the NAEI excludes emissions of CO2 originating from recently photosynthesised carbon as these will be part of the carbon cycle. Hence emissions from biomass combustion, the organic component of waste incineration, landfill and sewage treatment are not included in the total. Emissions of other pollutants from biomass combustion are included in the appropriate inventories. The NAEI also currently excludes CO2 emissions from the effect of changing land use although these emissions are estimated in the UK Greenhouse Gas Inventory (Salway, 2002) and are discussed below.
Methane, like carbon dioxide, is naturally occurring and is part of the global carbon cycle. However, the magnitudes of sinks and sources of methane are not well known. Methane in the atmosphere is eventually oxidised to CO2 and the most recent IPCC estimate of its lifetime in the atmosphere is 12±3 years (IPCC, 1996). Methane has a much greater warming effect on the climate than carbon dioxide (Table 2.1). The major anthropogenic sources of methane are waste disposal, agriculture, coal mining and leakage from the gas distribution system. Due to the nature of these sources the estimation of methane emissions is very uncertain although the methodologies are continuously being improved. Early estimates of methane emissions by sector were based on the findings of the Watt Committee on Energy (Williams, 1994), however many have now been revised to take into account new information and to ensure consistency with the methodologies recommended by the IPCC 1996 Revised Guidelines (IPCC, 1997).
The third direct greenhouse gas, nitrous oxide (N2O), is emitted from natural and anthropogenic sources (agriculture, biomass burning, coal combustion and some industrial processes). As N2O has a GWP of 310, it is a powerful greenhouse gas. However, emissions from the UK are low, so the overall contribution to global warming is relatively small (although still significant). A full set of detailed emission factors for man-made sources, e.g. combustion, are not yet available. However, emissions are estimated using the default values given in the guidelines and more detailed data on coal combustion based on UK literature.
The three industrial greenhouse gases included in the ‘basket of emissions’ agreed at Kyoto, namely hydrofluorocarbons (HFCs), perfluorocarbons (PFCs) and sulphur hexafluoride (SF6), have very high GWPs but the quantities emitted to the atmosphere are far smaller than the emissions of CO2. Hence the contribution of these gases to global warming was equivalent to just 3% of the total contribution from CO2 emissions in 1995 (MCG, 2000). These are gases with particular industrial applications; HFCs and PFCs are substitutes for chlorofluorocarbons (CFC) and hydrochlorofluorocarbons (HCFC) which are being phased out under the Montreal Protocol due to their role in the depletion of ozone in the stratosphere. A more detailed description of the usage, emissions and methodology for calculating emissions of these gases is given by MCG (2000).
The following sections present the inventories for each of the six greenhouse gases. To date, most international attention has focused on carbon dioxide and methane. Hence estimates of these pollutants were included in the UK inventory a number of years before the other four pollutants. This is reflected in the longer time series of data available for carbon dioxide and methane. The overall accuracy of the inventories is also discussed. Full details of the methodology used to compile the inventory and the changes which have been made since the publication of the inventory for 1999 are included in Appendices 1 and 2, respectively which can be accessed from the methodology section of the NAEI website (http://www.naei.org.uk)
CO2 emission estimates
Total CO2 emissions
Carbon dioxide emissions in 2000 have reduced by 22% since 1970, as shown in Figure 2.2. However, this decline has not been steady, and peaks were observed in 1973 and 1979 which were due to the state of the economy, high oil prices and severe winters in these years. Emissions fell again during the early eighties reflecting the recession during this period and the coal miners strike of 1984. Since the mid-1980s the emissions profile has been much smoother showing an overall reduction in emissions. There are small increases in several sectors. The elevated emission from the domestic sector in 1996 is considered to be due to the colder than average winter (indicated by lower than average mean air temperatures).
The major emissions of carbon dioxide arise from the
combustion of fossil fuels in power generation, and the transport, domestic and
industrial sectors (Figure 2.2, Table 2.2).
The level of emissions depends on the fuel mix and the fuel consumption
data. Details of UK fuel consumption
are given annually in the Department of Trade and Industry's Digest of United
Kingdom Energy Statistics (DTI, 2000, 2001).
The fuel consumption data used to calculate the pollutant emission
totals in the NAEI are given in Table 2.3; fuels which are used as feedstocks
are omitted (principally natural gas used for the production of ammonia,
methanol and acetic acid and some use of LPG and OPG in petrochemical plants).
Table 2.2 UK Emissions of CO2
as Carbon by UN/ECE1 Source Category and Fuel (Mt)
|
|
1970 |
1980 |
1990 |
1991 |
1992 |
1993 |
1994 |
1995 |
1996 |
1997 |
1998 |
1999 |
2000 |
2000% |
|
BY UN/ECE CATEGORY2 |
|
|
|
|
|
|
|
|
|
|
|
|
|
|
|
Comb. in Energy
Prod. |
|
|
|
|
|
|
|
|
|
|
|
|
|
|
|
Public Power |
57.0 |
58.3 |
54.1 |
53.3 |
50.4 |
45.5 |
44.4 |
44.1 |
43.5 |
39.6 |
40.6 |
38.8 |
42.0 |
28% |
|
Petroleum Refining Plants |
5.6 |
5.5 |
4.8 |
5.0 |
5.1 |
5.4 |
5.2 |
5.4 |
5.6 |
5.5 |
5.6 |
5.1 |
4.5 |
3% |
|
Other Comb. & Trans. |
8.2 |
2.9 |
3.8 |
3.8 |
3.8 |
3.8 |
4.4 |
4.8 |
5.3 |
5.4 |
5.8 |
5.9 |
5.9 |
4% |
|
Comb. in
Comm/Inst/Res |
|
|
|
|
|
|
|
|
|
|
|
|
|
|
|
Residential Plant |
26.5 |
23.2 |
21.5 |
23.9 |
23.1 |
24.2 |
22.9 |
21.7 |
24.7 |
22.7 |
23.2 |
23.1 |
23.4 |
16% |
|
Comm/Pub/Agri Comb. |
12.3 |
9.9 |
8.5 |
9.3 |
9.0 |
8.8 |
8.7 |
8.8 |
9.3 |
8.6 |
8.5 |
8.4 |
8.4 |
6% |
|
Combustion in
Industry |
|
|
|
|
|
|
|
|
|
|
|
|
|
|
|
Iron & Steel Comb. |
15.8 |
5.2 |
6.2 |
6.2 |
6.1 |
6.1 |
6.5 |
6.5 |
6.6 |
6.7 |
6.3 |
6.2 |
5.8 |
4% |
|
Other Ind. Comb. |
32.5 |
24.9 |
18.3 |
18.4 |
18.3 |
17.9 |
18.0 |
17.4 |
17.5 |
17.6 |
17.2 |
17.1 |
16.7 |
11% |
|
Production
Processes |
4.8 |
3.9 |
4.0 |
3.3 |
3.2 |
3.2 |
3.5 |
3.5 |
3.8 |
3.6 |
3.5 |
3.7 |
3.7 |
3% |
|
Extr./Distrib. of
Fossil Fuels |
0.1 |
0.1 |
0.4 |
0.2 |
0.2 |
0.1 |
0.2 |
0.2 |
0.2 |
0.2 |
0.2 |
0.24 |
0.2 |
0% |
|
Road Transport |
16.3 |
21.2 |
29.7 |
29.5 |
29.9 |
30.3 |
30.4 |
30.1 |
31.3 |
31.7 |
31.5 |
31.7 |
31.5 |
21% |
|
Other Trans/Mach |
|
|
|
|
|
|
|
|
|
|
|
|
|
|
|
Off-Road Sources |
3.1 |
3.0 |
3.2 |
3.0 |
2.9 |
2.9 |
2.8 |
2.7 |
2.8 |
2.6 |
2.4 |
2.3 |
2.2 |
1% |
|
Other3 |
2.3 |
2.0 |
1.7 |
1.8 |
1.8 |
1.8 |
1.7 |
1.7 |
1.7 |
1.7 |
1.7 |
1.6 |
1.6 |
1% |
|
Waste |
0.3 |
3.4 |
2.3 |
2.1 |
2.0 |
2.0 |
2.6 |
2.0 |
2.0 |
1.6 |
1.6 |
1.4 |
1.4 |
1% |
|
Agricul & Land
Use Change |
0.5 |
0.4 |
0.4 |
0.5 |
0.5 |
0.3 |
0.3 |
0.4 |
0.4 |
0.4 |
0.3 |
0.2 |
0.2 |
0% |
|
By FUEL TYPE |
|
|
|
|
|
|
|
|
|
|
|
|
|
|
|
Solid |
90.3 |
70.6 |
61.4 |
61.0 |
57.4 |
49.4 |
46.0 |
42.7 |
39.6 |
34.4 |
34.3 |
30.5 |
32.0 |
22% |
|
Petroleum |
67.7 |
54.5 |
52.9 |
52.8 |
53.0 |
52.9 |
51.7 |
50.2 |
51.4 |
49.4 |
48.1 |
47.0 |
45.8 |
31% |
|
Gas |
22.7 |
32.2 |
38.8 |
41.0 |
40.7 |
45.0 |
47.8 |
50.7 |
57.8 |
58.7 |
60.7 |
63.5 |
64.9 |
44% |
|
Non-Fuel |
4.7 |
7.0 |
6.2 |
5.4 |
5.2 |
5.0 |
6.0 |
5.5 |
5.7 |
5.5 |
5.4 |
5.0 |
4.8 |
3% |
|
TOTAL |
185.3 |
164.2 |
159.2 |
160.2 |
156.3 |
152.3 |
151.5 |
149.2 |
154.6 |
147.9 |
148.4 |
146.0 |
147.5 |
100% |
1 UK emissions reported in IPCC
format (Salway, 2001) differ slightly due to the different source categories
used.
2 See Annex 1 for definition of
UN/ECE Categories
3 Railways, civil aircraft,
shipping, naval vessels and military aircraft.
Figure 2.2 Time Series of CO2 Emissions
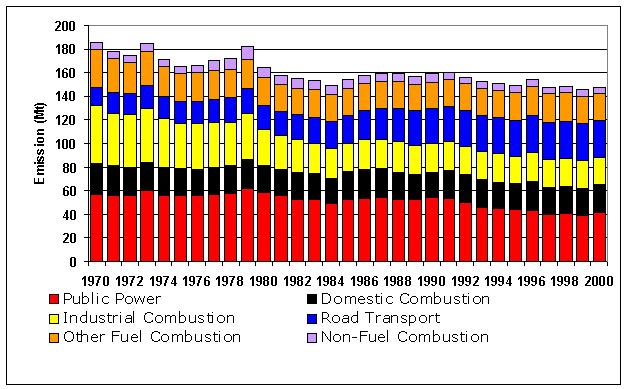
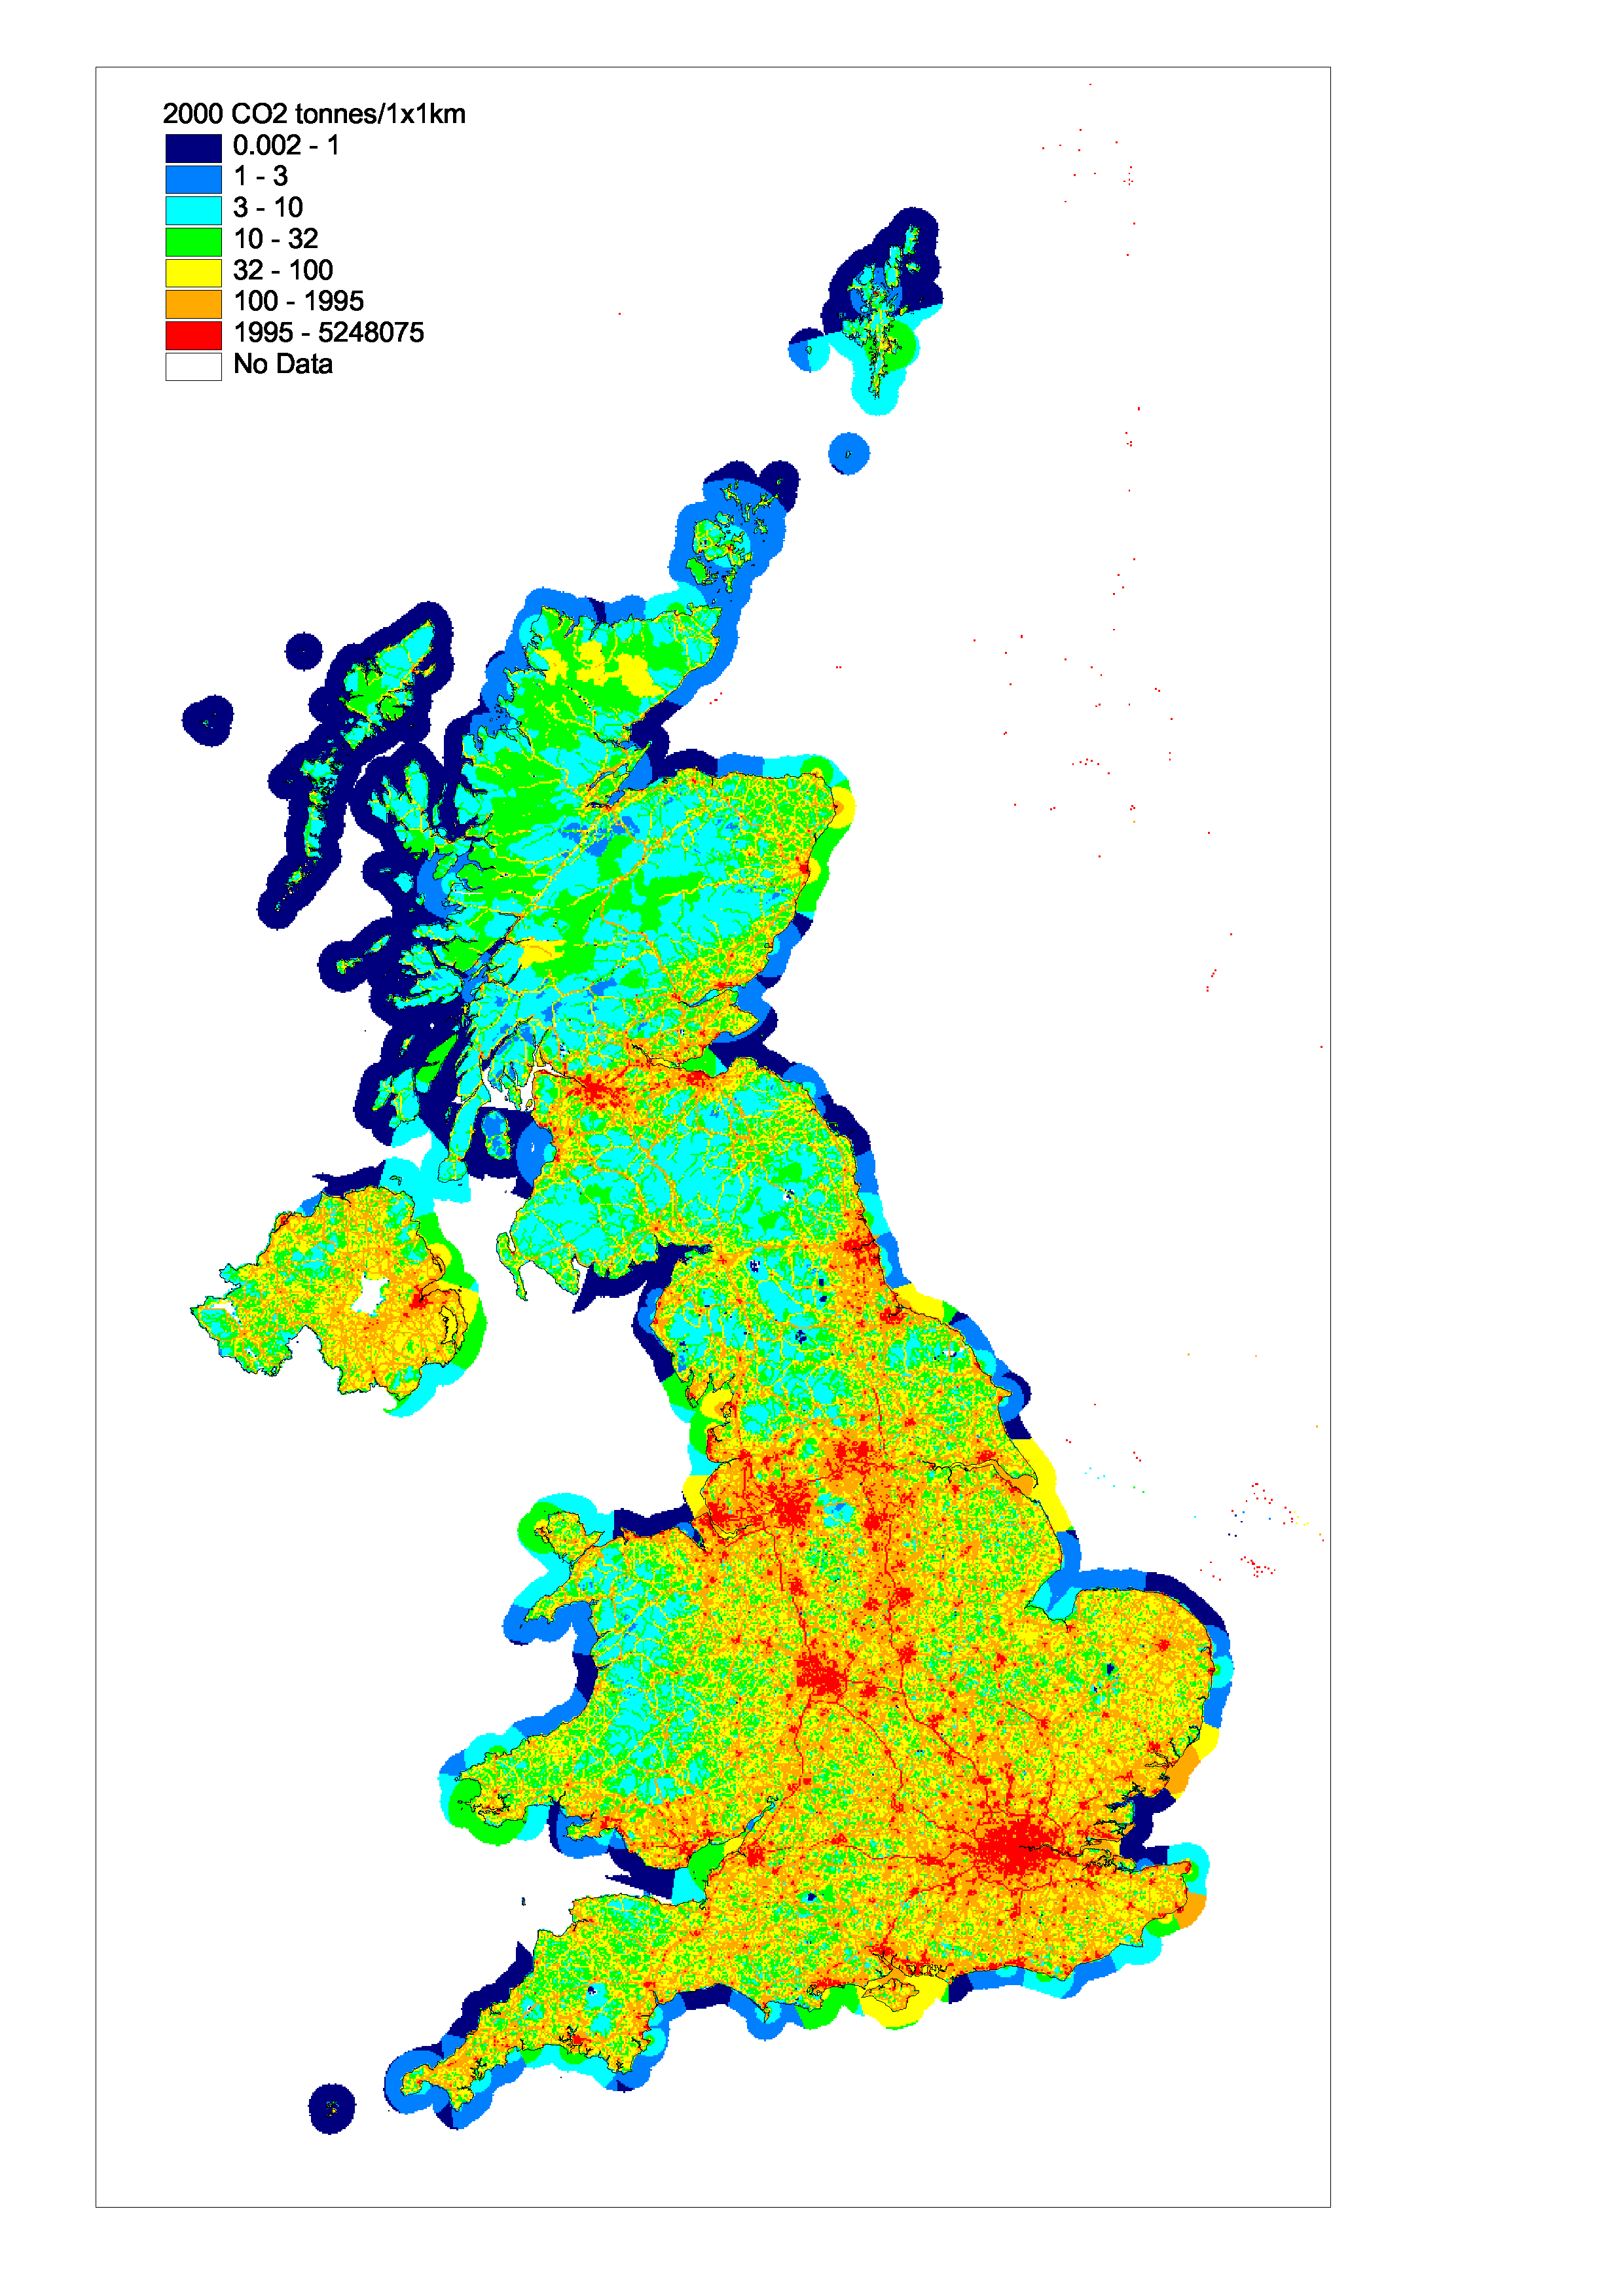
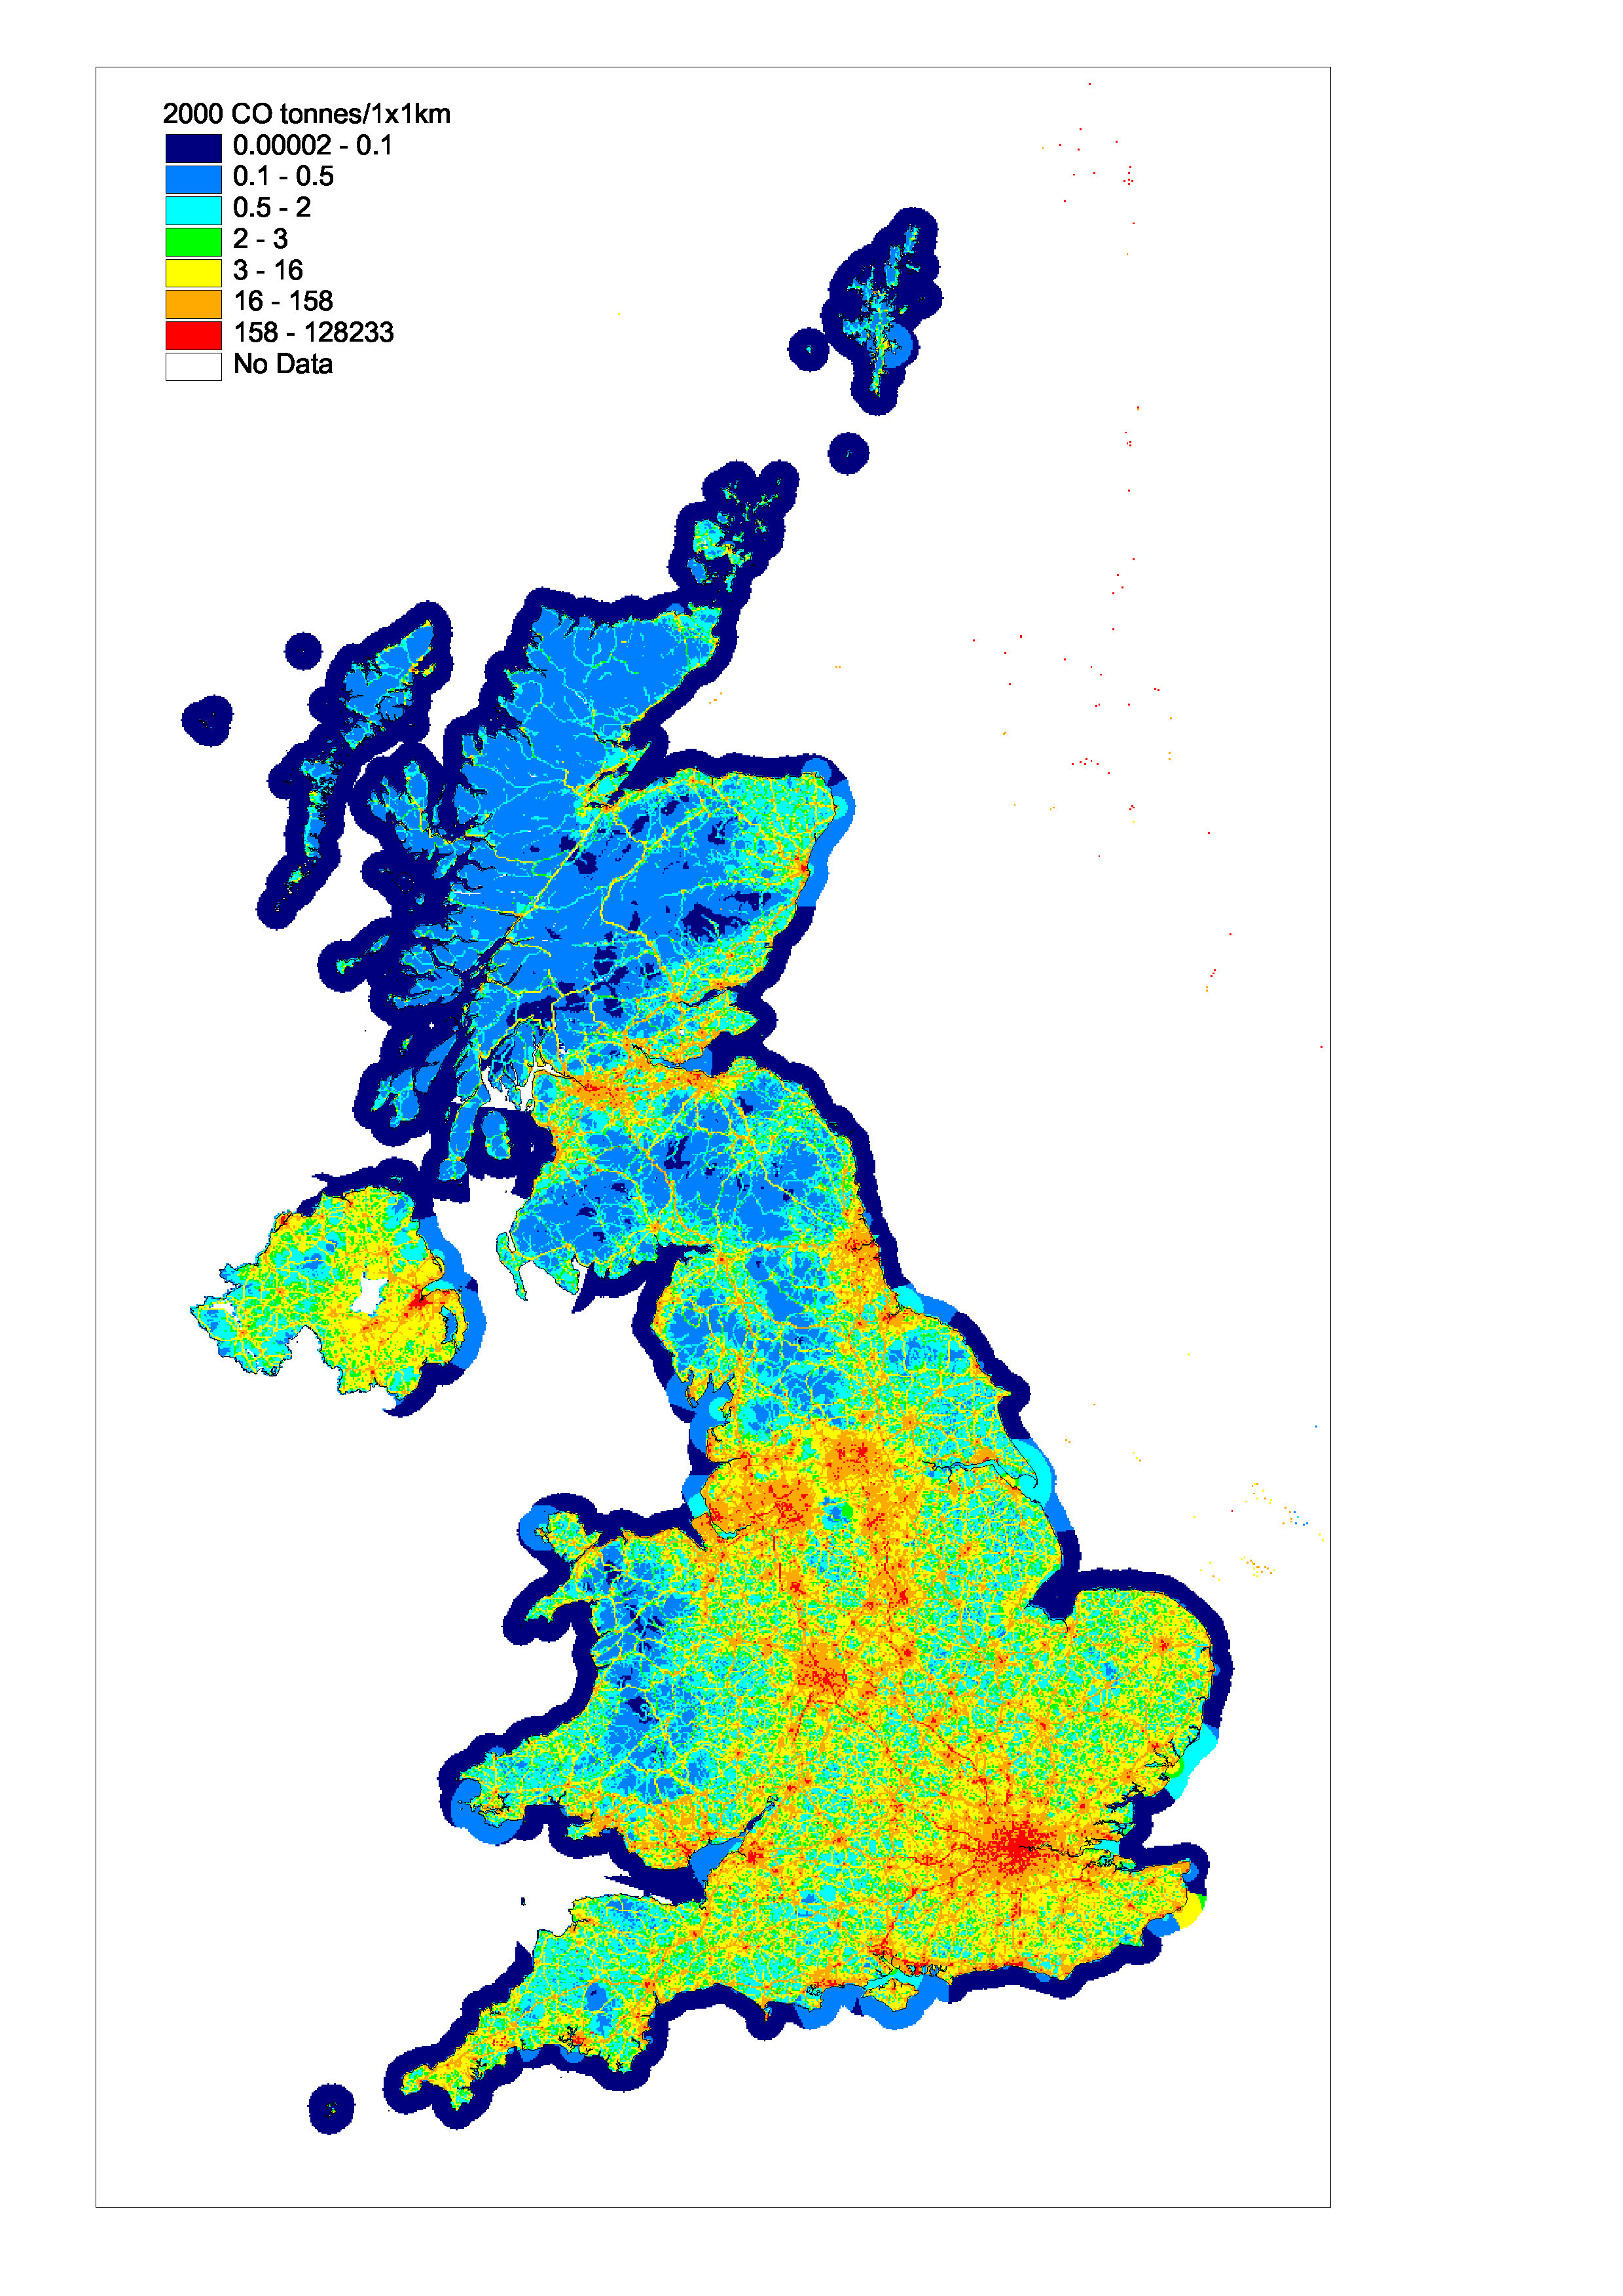
Figure 2.3, Spatially Disaggregated UK Emissions of CO2
Electricity supply industry
The electricity supply industry is the major consumer of fossil fuels, and hence the major source of carbon dioxide emissions in the UK (Tables 2.2 and 2.3). There have been significant changes in the generating mix between 1980 and 2000, as shown in Figure 2.4. The level of CO2 emissions is determined by both the fuel mix and the generating technology used. During the 1970s the electricity supply industry was dominated by coal and fuel oil fired thermal power stations, and coal and oil consumption increased to meet the rising demand for electricity. The use of coal for power generation peaked in 1980 at 89.6 Mt and has subsequently declined. The fall has not been steady, showing minima in 1982 and 1984 due to recession in the early 1980s and the miners strike of 1984. During the late 1980s and early 1990s, the closure of inefficient plants led to an overall increase in the thermal efficiency of the conventional thermal power plants, and the contribution of nuclear power generation increased with the greater utilisation of existing nuclear plants and the commissioning of Sizewell B in 1995. The use of oil generation peaked in 1972 and apart from increased consumption during the miners strike of 1984 has been in decline ever since. Two oil-fired stations were converted to burn Orimulsion® (an emulsion of bitumen and water) although this practice has been discontinued, largely on environmental grounds. More recently, the privatisation of the power industry has resulted in a move away from coal and oil generation towards combined cycle gas turbines (CCGT). The use of gas in power generation has increased by a huge amount. Further increases may be expected as and when more CCGT stations come on line.
Table 2.3 UK Fuel Consumption
|
Fuel |
Consumer |
|
1970 |
1980 |
1990 |
1995 |
1996 |
1997 |
1998 |
1999 |
2000 |
|
|
|
|
|
|
|
|
|
|
|
|
|
|
Coal |
Major Power Prod. |
Mtonnes |
77 |
90 |
83 |
58 |
53 |
45 |
47 |
40 |
45 |
|
Coal |
Industry |
Mtonnes |
22 |
9 |
8 |
6 |
5 |
5 |
4 |
4 |
3 |
|
Coal |
Domestic |
Mtonnes |
20 |
9 |
4 |
3 |
3 |
3 |
2 |
3 |
2 |
|
Coal |
Others |
Mtonnes |
38 |
16 |
14 |
10 |
10 |
10 |
10 |
9 |
10 |
|
Other Solid Fuels |
All Consumers |
Mtonnes |
26 |
10 |
11 |
10 |
10 |
10 |
9 |
9 |
9 |
|
Motor Spirit |
Road Transport |
Mtonnes |
14 |
19 |
24 |
22 |
22 |
22 |
22 |
22 |
21 |
|
Gas Oil |
Road Transport |
Mtonnes |
5 |
6 |
11 |
13 |
14 |
15 |
15 |
16 |
16 |
|
Gas Oil |
Industry |
Mtonnes |
5 |
5 |
3 |
3 |
3 |
3 |
3 |
3 |
3 |
|
Gas Oil |
Others |
Mtonnes |
8 |
8 |
6 |
6 |
6 |
6 |
6 |
5 |
5 |
|
Fuel Oil |
Major Power Prod. |
Mtonnes |
12 |
6 |
6 |
2 |
2 |
1 |
1 |
1 |
1 |
|
Fuel Oil |
Refineries |
Mtonnes |
4 |
4 |
2 |
2 |
2 |
2 |
2 |
2 |
1 |
|
Fuel Oil |
Industry |
Mtonnes |
21 |
10 |
4 |
3 |
3 |
2 |
2 |
1 |
1 |
|
Fuel Oil |
Others |
Mtonnes |
10 |
4 |
2 |
3 |
3 |
3 |
2 |
2 |
1 |
|
Orimulsion |
Major Power Prod. |
Mtonnes |
0 |
0 |
0 |
1 |
1 |
0 |
0 |
0 |
0 |
|
Burning Oil |
Domestic |
Mtonnes |
2 |
2 |
2 |
2 |
3 |
3 |
3 |
2 |
2 |
|
Burning Oil |
Others |
Mtonnes |
4 |
0 |
0 |
1 |
1 |
1 |
1 |
1 |
1 |
|
Aviation Turbine
Fuel |
Air Transport |
Mtonnes |
3 |
5 |
7 |
8 |
8 |
8 |
9 |
10 |
11 |
|
Other Pet.
Products |
All Consumers |
Mtonnes |
1 |
1 |
1 |
2 |
2 |
2 |
2 |
2 |
2 |
|
|
|
|
|
|
|
|
|
|
|
|
|
|
Petroleum Gases |
Refineries |
Mtherms |
1011 |
987 |
1303 |
1382 |
1460 |
1378 |
1318 |
1278 |
1308 |
|
Petroleum Gases |
Others |
Mtherms |
700 |
717 |
680 |
858 |
858 |
760 |
742 |
728 |
687 |
|
Natural Gas |
Major Power Prod. |
Mtherms |
60 |
55 |
3 |
4540 |
6029 |
7633 |
8063 |
9622 |
9683 |
|
Natural Gas |
Industry |
Mtherms |
710 |
6616 |
7016 |
7967 |
8783 |
9152 |
9698 |
10111 |
10531 |
|
Natural Gas |
Domestic |
Mtherms |
627 |
8420 |
10250 |
11124 |
12824 |
11790 |
12144 |
12218 |
12622 |
|
Natural Gas |
Others |
Mtherms |
2206 |
2188 |
3021 |
3945 |
4375 |
4172 |
4382 |
4502 |
4801 |
|
Other Gases |
All Consumers |
Mtherms |
7009 |
1126 |
1371 |
1268 |
1339 |
1394 |
1397 |
1409 |
1430 |
Figure 2.4 Generating Mix (1980-2000) Million Tonnes Oil Equivalent (Mtoe).
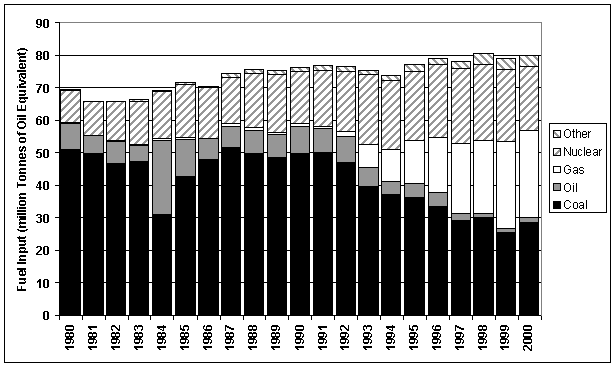
The effect of these changes in the power sector are clearly reflected in the carbon dioxide emissions. Since 1970 electricity generation has increased by nearly 50% but emissions have decreased by around 26%. Despite a slight increase in coal consumption between 1999 and 2000, emissions have fallen by 22% between 1990 and 2000. This is due specifically to:
· The greater efficiency of the CCGT stations compared with conventional stations - around 47% as opposed to 36%.
· The calorific value of natural gas per unit mass carbon being higher than that of coal and oil (the inventory takes account of unrefined gas or sour gas used by some plant).
· and to a lesser extent, the proportion of nuclear generated electricity increasing from 21% to 25%.
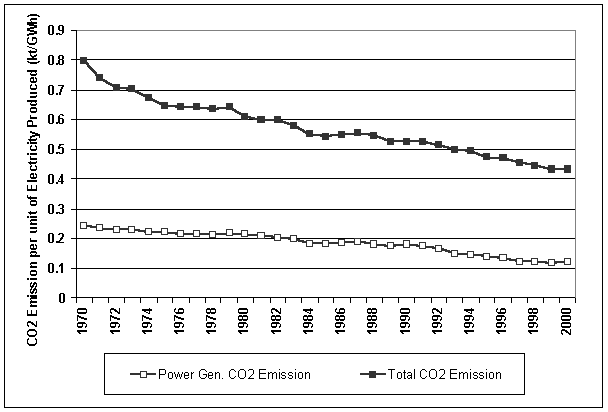
The overall effect of the fuel and technology changes are also clearly illustrated in Figure 2.5 which shows that the average CO2 emission (from power generation) per kWh electricity generated decreases from 245 tonnes/GWh in 1970 to 123 tonnes/GWh in 2000. This trend is likely to continue into the future through the use of more advanced technology and abatement equipment. However, the extent to which nuclear power is used in the future is expected to have a large impact on air emissions. A decreased use of nuclear power for electricity production is expected to give rise to increased consumption of fossil fuels, and the increased use of coal between 1999 and 2000 is evident.
Figure 2.5 Average CO2 Emission per unit of Electricity Generated (ktonne/GWh)
Domestic
The domestic use of coal (including anthracite) shows an overall decline between 1970 and 2000, falling by 91%; domestic use of smokeless solid fuels (including coke) has also fallen significantly. This reflects a trend away from solid fuels towards alternatives such as electricity and gas in the domestic sector. Over the same period the domestic use of natural gas has increased by a factor of over 20.
Industrial
The 2000 industrial emissions show a decrease of 53% since 1970. The curve exhibits peaks in 1973, 1979, and 1988 which are due in part to the cold winters in these years but mainly to the various levels of economic activity. According to DTI (2001), industrial energy consumption in 2000 has declined since 1970 by 43% reflecting the decline in a number of the energy intensive industries conducted in the UK and improvements in energy efficiency. Over this period, there has also been a marked move away from coal and oil consumption to gas and to a lesser extent electricity.
Transport
Total emissions from the transport sector have steadily increased since 1970. Of these, road transport emissions have risen by 94% and currently account for 89% of the total transport/mobile machinery emissions in 2000. This also equates to 24% of the total UK carbon dioxide emissions. Emissions fell a little during 1974-75 reflecting the increase in motor fuel prices after the oil crisis. The steady increase in fuel use by most forms of transport reflects the increased demand for transport in the UK between 1970 and 2000. The increased use of private motor vehicles has resulted in a 50% increase in the consumption of petrol from 1970 to 2000. However, petrol consumption has declined by 12% since 1990, which is a result of the increase in popularity of diesel cars, and the increased fuel efficiency of petrol driven cars. Increased use of goods vehicles is reflected in the increase in DERV consumption by a factor of more than 3 since 1970.
Agriculture/forests/land use change
The effect of changing land-use can result in either net emission or net absorption of CO2 , particularly on a global scale. For example, forest clearing for agricultural use could be a net source of CO2. Recently the Intergovernmental Panel on Climate Change agreed new guidelines for preparing national inventories (IPCC, 1997). Land use change and forestry estimates are included in the UK Greenhouse Gas Inventory (Salway et al, 2002) for the years 1990-2000. The estimates have yet to be included in the NAEI which covers the longer period 1970-2000 (the entry under "Agricul. & Land use change" in Table 2.2 corresponds to the CO2 emissions arising from the application of lime to soils). For comparative purposes the land use change estimates of carbon emissions and removals are summarised in Table 2.4 (Milne, 2000). The new guidelines for Land Use Change and Forestry include emissions from liming of soils under ‘D CO2 Emissions and Removals from Soils’. These are already included in the NAEI under Agricultural Soils.
Table 2.4 Emissions & Removals of CO21 (as CO2) from Land Use Change & Forestry (2000)
|
Sources |
|
|
Emissions (kt) |
Removals (kt) |
|
A. Changes in Forest and Other Woody Biomass Stocks 1 |
|
- |
10,553 |
|
|
B. Forest and Grassland conversion |
|
- |
- |
|
|
C. Abandonment of Managed Lands |
|
- |
- |
|
|
D. CO2 Emissions and Removals from Soil 2 |
|
11,441 |
- |
|
|
E. Other 3 |
|
|
3,567 |
1,100 |
|
Total |
|
|
15,007 |
11,653 |
1 Removals
include removals to forest and soil litter, and to forest products.
2 Emissions include removals to soil due to
set aside of arable land
3 Emissions include emissions from soil due
to upland drainage, lowland drainage and peat extraction. Removals are
increases in crop biomass.
CH4 emission Estimates
Total CH4 emissions
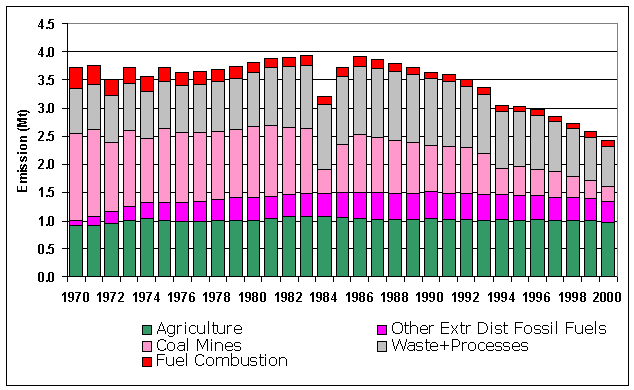
Since 1970, the total methane emission in the UK has declined by 35%, although this has not been a steady decrease with emissions actually increasing throughout the seventies, reaching a peak in 1983 (Figure 2.6). There was a temporary fall in emissions in 1984 as a result of the miners strike reducing emissions from coal mines. The major sources of methane are landfill sites, livestock in the agricultural sector, leakage during the transmission and distribution of natural gas and coal mines (Table 2.5). The patterns of emissions from each of these sectors are discussed in the following sections.
Figure 2.6 Time series of CH4 Emissions
Landfill
Landfills are estimated to account for 27% of the UK’s methane emissions in 2000. However, the estimation is relatively complex as it needs to take account of the wide range of different types of landfill sites in the UK and the variation in methane emissions during the lifetime of a landfill site. Methane emissions are derived from estimates of the amount of putrescible waste disposed of to landfill. Based on a model of the kinetics of anaerobic digestion the rate of methane production is estimated. Corrections are then applied for methane recovery, utilisation, flaring and oxidation by capping soil on the different landfill sites.
The methane emission from landfill shows a gradual increase to a peak in the mid 1980’s followed by a decline because of the implementation of methane recovery systems. This trend is likely to continue since all new landfill sites after 1994 must collect and utilise (or flare) the methane emissions. Similarly, since 1994 the combustion of landfill gas has been required at all existing sites in the UK which have significant remaining capacity and where significant gas production is likely. The uncertainties associated with the estimation of methane from landfills are large and it is likely that these estimates will be further refined in the future as more information becomes available.
Agriculture
The largest source of methane emissions is the agricultural sector where the emissions arise from enteric fermentation in the guts of ruminant animals and from animal wastes. Emissions increased in the early seventies and have declined extremely slowly since 1974. The methane emission is dependent on the numbers and types of farm animals-with dairy cattle being the most significant source. The recent decline results from the reduction in dairy cattle numbers in line with the 1992 CAP reforms and gradual increases in animal productivity. It is expected that there will be further reductions in animal numbers leading to a continued reduction in the emission of methane.
Table 2.5 UK Emissions of Methane by UN/ECE1 Source Category (kt)
|
|
1970 |
1980 |
1990 |
1991 |
1992 |
1993 |
1994 |
1995 |
1996 |
1997 |
1998 |
1999 |
2000 |
2000% |
|
BY UN/ECE CATEGORY2 |
|
|
|
|
|
|
|
|
|
|
|
|
|
|
|
Comb. in Energy
Prod. |
|
|
|
|
|
|
|
|
|
|
|
|
|
|
|
Public Power |
2 |
2 |
6 |
6 |
8 |
9 |
10 |
12 |
14 |
16 |
19 |
24 |
28 |
1% |
|
Petroleum Refining Plants |
1 |
1 |
1 |
1 |
1 |
1 |
1 |
1 |
1 |
1 |
1 |
1 |
1 |
0% |
|
Other Comb. & Trans. |
1 |
1 |
1 |
1 |
2 |
2 |
2 |
3 |
3 |
4 |
3 |
8 |
7 |
0% |
|
Comb. in Comm/Inst/Res |
|
|
|
|
|
|
|
|
|
|
|
|
|
|
|
Residential Plant |
326 |
139 |
65 |
68 |
62 |
61 |
47 |
35 |
37 |
34 |
36 |
39 |
29 |
1% |
|
Comm/Pub/Agri Comb. |
2 |
2 |
4 |
5 |
4 |
4 |
4 |
4 |
5 |
4 |
4 |
4 |
4 |
0% |
|
Combustion in
Industry |
25 |
12 |
13 |
13 |
12 |
12 |
13 |
13 |
13 |
14 |
14 |
13 |
12 |
1% |
|
Production
Processes |
9 |
8 |
8 |
8 |
9 |
7 |
9 |
7 |
8 |
7 |
5 |
4 |
4 |
0% |
|
Extr./Distrib. of
Fossil Fuels |
|
|
|
|
|
|
|
|
|
|
|
|
|
|
|
Coal Mines |
1540 |
1269 |
818 |
838 |
803 |
724 |
456 |
504 |
473 |
445 |
375 |
310 |
264 |
11% |
|
Gas Leakage |
88 |
354 |
398 |
387 |
382 |
377 |
372 |
368 |
362 |
349 |
346 |
346 |
333 |
14% |
|
Offshore Oil&Gas |
13 |
43 |
93 |
84 |
87 |
80 |
77 |
73 |
67 |
67 |
62 |
44 |
40 |
2% |
|
Gasoline Distribution |
|
|
|
|
|
|
|
0 |
0 |
0 |
0 |
0 |
0 |
0% |
|
Road Transport |
18 |
23 |
30 |
29 |
28 |
26 |
25 |
23 |
22 |
21 |
19 |
17 |
16 |
1% |
|
Other Trans/Mach 3 |
3 |
2 |
2 |
2 |
2 |
2 |
2 |
2 |
2 |
2 |
2 |
2 |
2 |
0% |
|
Waste |
|
|
|
|
|
|
|
|
|
|
|
|
|
|
|
Landfill |
764 |
889 |
1117 |
1080 |
1031 |
984 |
945 |
912 |
872 |
826 |
774 |
716 |
660 |
27% |
|
Non Landfill Waste |
32 |
66 |
55 |
51 |
54 |
54 |
62 |
65 |
64 |
59 |
59 |
56 |
58 |
2% |
|
Agricul. &
Land Use Change |
|
|
|
|
|
|
|
|
|
|
|
|
|
|
|
Animal Wastes |
106 |
113 |
111 |
110 |
110 |
111 |
112 |
110 |
111 |
111 |
112 |
110 |
105 |
4% |
|
Enteric Fermentation |
781 |
870 |
908 |
895 |
900 |
900 |
907 |
897 |
905 |
893 |
894 |
894 |
864 |
36% |
|
Non Livestock Agricult. |
14 |
21 |
13 |
11 |
8 |
0 |
0 |
0 |
0 |
0 |
0 |
0 |
0 |
0% |
|
By FUEL TYPE |
|
|
|
|
|
|
|
|
|
|
|
|
|
|
|
Solid |
331 |
140 |
67 |
69 |
63 |
62 |
48 |
35 |
37 |
34 |
36 |
38 |
28 |
1% |
|
Petroleum |
26 |
29 |
34 |
33 |
32 |
31 |
29 |
28 |
27 |
25 |
23 |
21 |
19 |
1% |
|
Gas |
18 |
11 |
21 |
23 |
23 |
25 |
27 |
30 |
34 |
37 |
39 |
49 |
51 |
2% |
|
Non-Fuel |
3350 |
3635 |
3523 |
3464 |
3384 |
3237 |
2940 |
2935 |
2862 |
2756 |
2626 |
2480 |
2328 |
96% |
|
TOTAL |
3724 |
3815 |
3645 |
3589 |
3503 |
3354 |
3044 |
3028 |
2960 |
2852 |
2724 |
2589 |
2427 |
100% |
1 UK emissions reported in IPCC
format (Salway, 2002) differ slightly due to the different source categories used.
2 See Annex 1 for definition of UN/ECE Categories
3 Railways, civil aircraft,
shipping, naval vessels, military aircraft and off-road sources.
Coal mining
Methane emissions from coal mining have reduced significantly during the past 20 years reflecting the reduction in UK coal production. In 1970 the emission accounted for 41% of total UK emissions but by 2000 this had reduced to just 11%. The strong correlation between coal production and methane emission is clearly illustrated by the large fall in emissions during the 1984 miners strike. The reduction in mining emissions is the most important contributor to the overall fall in methane emissions.
Leakage from the gas distribution system
Methane leakage from the gas distribution system increased substantially between 1970 and 1990 reflecting the growth in gas sales. It currently accounts for 14% of UK methane emissions. Emissions are estimated based on the throughput of gas and hence are rather uncertain. However, since 1990, emission estimates are based on actual leakage measurements made by British Gas (and successor companies) together with data on their gas main replacement programme. Emissions have declined as old mains are replaced by new ones.
Offshore oil and gas
Methane emissions from offshore activities only account for 2% of total UK emissions but have declined in recent years (despite the increase in the number of installations). Emissions are estimated on the basis of data provided by the operating companies to the UK Offshore Operators Association. Methane emissions from cold venting, natural gas use, well testing, fugitive emissions and flaring from offshore platforms are now all estimated separately. Of these, venting is the main source of methane. Other sources are fuel oil and gas combustion and emissions from tanker loading and unloading.
Sewage disposal
Methane emissions from sewage disposal are fairly uncertain but are likely to be quite small. They depend on the mode of disposal: sea dumping; land spreading or incineration. The proportion disposed of in landfills is allocated to the landfill estimate. Emissions are likely to rise as a result of the EC Urban Waste Water Treatment Directive but the rate of increase will depend on the disposal routes adopted. The UK stopped dumping sewage at sea in 1998.
N2O Emission ESTimates
The major source of nitrous oxide emissions in the UK are from agricultural activities. Lower levels of emissions arise from industrial processes, combustion processes in the power generation sector and from road transport (Table 2.6 and Figure 2.7).
Table 2.6 UK Emissions of Nitrous Oxide (N2O) by UN/ECE1 Category(kt)
|
|
1970 |
1980 |
1990 |
1991 |
1992 |
1993 |
1994 |
1995 |
1996 |
1997 |
1998 |
1999 |
2000 |
2000% |
|
BY UN/ECE CATEGORY2 |
|
|
|
|
|
|
|
|
|
|
|
|
|
|
|
Comb. in Energy
Prod. |
|
|
|
|
|
|
|
|
|
|
|
|
|
|
|
Public Power |
|
|
6.2 |
6.1 |
5.8 |
5.4 |
5.5 |
5.6 |
5.8 |
5.8 |
6.2 |
6.3 |
6.7 |
5% |
|
Petroleum Refining Plants |
|
|
0.4 |
0.4 |
0.4 |
0.4 |
0.4 |
0.4 |
0.4 |
0.4 |
0.4 |
0.4 |
0.3 |
0% |
|
Other Comb. & Trans. |
|
|
0.8 |
0.8 |
0.8 |
0.9 |
1.0 |
1.0 |
1.1 |
1.2 |
1.3 |
1.3 |
1.4 |
1% |
|
Comb. in
Comm/Inst/Res |
|
|
1.2 |
1.3 |
1.2 |
1.2 |
1.1 |
0.9 |
0.9 |
0.8 |
0.8 |
0.8 |
0.7 |
0% |
|
Combustion in
Industry |
|
|
2.1 |
2.1 |
2.3 |
2.1 |
2.1 |
2.1 |
1.9 |
1.8 |
1.6 |
1.6 |
1.4 |
1% |
|
Production
Processes |
|
|
94.5 |
88.5 |
71.6 |
61.1 |
71.5 |
61.3 |
65.5 |
67.0 |
59.5 |
18.2 |
20.0 |
14% |
|
Extract/Distrib
Fossil Fuels |
|
|
0.1 |
0.0 |
0.0 |
0.0 |
0.0 |
0.0 |
0.0 |
0.0 |
0.0 |
0.0 |
0.0 |
0% |
|
Road Transport |
|
|
3.3 |
3.4 |
3.8 |
4.7 |
5.9 |
7.1 |
8.4 |
9.7 |
10.8 |
11.9 |
12.7 |
9% |
|
Other Trans/Mach3 |
|
|
3.7 |
3.8 |
3.8 |
3.7 |
3.6 |
3.5 |
3.6 |
3.4 |
3.4 |
3.2 |
3.1 |
2% |
|
Waste |
|
|
3.7 |
3.7 |
3.7 |
3.7 |
3.7 |
3.7 |
3.8 |
3.8 |
3.8 |
3.8 |
4.0 |
3% |
|
Land Use Change |
|
|
|
|
|
|
|
|
|
|
|
|
|
|
|
Animal Wastes |
|
|
4.9 |
4.9 |
4.8 |
4.8 |
4.9 |
4.8 |
4.9 |
4.9 |
4.9 |
4.9 |
4.6 |
3% |
|
Non Livestock Agricult. |
|
|
98.2 |
97.7 |
92.4 |
90.7 |
93.1 |
93.6 |
94.2 |
97.1 |
94.3 |
92.4 |
86.4 |
61% |
|
By FUEL TYPE |
|
|
|
|
|
|
|
|
|
|
|
|
|
|
|
Solid |
|
|
8.6 |
8.7 |
8.3 |
7.1 |
6.7 |
6.2 |
5.7 |
4.9 |
4.8 |
4.3 |
4.3 |
3% |
|
Petroleum |
|
|
7.8 |
8.0 |
8.5 |
9.3 |
10.4 |
11.5 |
12.9 |
13.9 |
14.9 |
15.8 |
16.5 |
12% |
|
Gas |
|
|
1.2 |
1.2 |
1.3 |
1.9 |
2.5 |
2.9 |
3.6 |
4.3 |
4.6 |
5.2 |
5.4 |
4% |
|
Non-Fuel |
|
|
201.3 |
194.8 |
172.6 |
160.3 |
173.3 |
163.5 |
168.5 |
172.9 |
162.6 |
119.4 |
115.1 |
81% |
|
TOTAL |
|
|
218.9 |
212.7 |
190.6 |
178.7 |
192.8 |
184.1 |
190.7 |
196.0 |
186.9 |
144.7 |
141.3 |
100% |
1 UK emissions reported in IPCC format (Salway, 2001) differ slightly
due to the different source categories used.
2 See Annex 1 for definition of UN/ECE Categories
3 Including railways,
shipping, naval vessels, military aircraft and off-road sources
Figure 2.7 Time Series of N2O Emissions
Agriculture
The calculation of emissions from agricultural soils and animal wastes have been considerably extended in recent years. In particular, the publication of the Revised 1996 IPCC Guidelines (IPCC, 1997) has enabled a greater number of sources to be considered. Further details of the methodology are given in Appendices 1 and 2.
The emissions from agricultural soils currently account for around 61% of total UK emissions. The most significant sources are fertiliser application and emissions indirectly from leaching.
Production processes
The production processes sector is comprised of emissions from adipic acid manufacture (a feedstock for nylon) and nitric acid manufacture. This sector accounts for 14% of the total nitrous oxide emissions in 2000. The extent of the emission depends on the production of these acids, hence the time series reflects production levels. However, the UK manufacturer of adipic acid commissioned an abatement unit in 1998 which has significantly reduced the UK total emission.
Power generation
The contribution from public power generation has been relatively constant between 1990 and 2000 in spite of the trend away from coal towards natural gas combustion.
Road transport
Emissions
from the road transport sector have increased significantly since 1992. This is
as a direct result of the introduction of three way catalytic converters which
produce significantly larger emissions of nitrous oxide than cars not equipped
with abatement technology. Between 1990
and 2000 the proportion of the car kilometres with converters has increased
from <1% to 60% (Figure 2.8) and emissions of N2O have greatly
increased. The contribution of road
transport to the total N2O emission is small, but is expected to
increase. Conversely emissions from the majority of the currently significant
sectors are expected to decrease with time.
Figure 2.8 The growth in number of
cars with catalytic converters
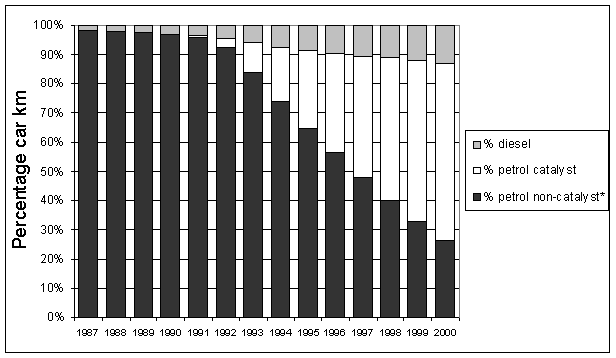
*Includes
cars with failed catalysts
HFCs, PFCs and SF6 Emission Estimates
Hydrofluorocarbons
The UK emissions of HFCs are shown in Table 2.7. The emissions are reported in terms of their global warming potential (GWP). The HFC emissions comprise many species each with its own GWP, hence it is more helpful to express emissions in terms of GWP as Carbon equivalent. It is not currently possible to give emission estimates for individual HFCs because some of these are considered commercially sensitive data within the industries involved.
HFCs had limited usage primarily as refrigerants blended with CFCs. However, CFCs and HCFCs are being phased out under the Montreal protocol, and hence HFCs are now being used increasingly as:
· substitutes for CFCs and HCFCs in domestic, commercial and industrial refrigeration and air conditioning
· substitutes for CFCs in plastic foam blowing
· substitutes for CFCs for some medical aerosols
· substitutes for CFCs for industrial and specialist aerosols
· fire fighting fluids
Salway (2002) reports the emissions, estimation methodology and ongoing improvements in some detail. The UK reports both actual and potential emissions of HFCs, although here only the actual emissions are presented.
Refrigeration is the largest source and contributed 36% of the total in 2000. Here emissions arise due to leakage from refrigeration and air conditioning equipment during its life time and from losses during manufacture and the recovery of the refrigerants on decommissioning.
There has been a large decrease in emissions from “Halocarbon production” from 1998 to 1999. This is a result of an abatement system fitted to a plant producing HCFCs.
In the case of closed foams where the fluid is retained within the foam there will be some leakage from the foam during its lifetime and on disposal but with open foams all losses occur during manufacture. Since 1990, the use of HFCs in aerosols has greatly increased, and this source sector now accounts for 13% of the total emission.
The total 2000 HFC UK emission has decreased by 24% compared with the 1990 emission and is characterised by the increasing use of HFCs offset by the large reduction in emissions from halocarbon production between 1998 and 2000.
Table 2.7 UK Emissions of HFCs (ktonnes C equivalent)
|
|
1990 |
1991 |
1992 |
1993 |
1994 |
1995 |
1996 |
1997 |
1998 |
1999 |
2000 |
2000% |
|
Halocarbon production |
3102 |
3229 |
3357 |
3485 |
3614 |
3807 |
3898 |
4266 |
4509 |
1179 |
1177 |
46% |
|
Foams & Firefighting |
0 |
0 |
0 |
0 |
0 |
1 |
5 |
9 |
11 |
15 |
37 |
1% |
|
Refrigeration |
0 |
2 |
6 |
26 |
121 |
228 |
333 |
482 |
628 |
775 |
915 |
36% |
|
Aerosols1 |
0 |
3 |
4 |
8 |
32 |
111 |
207 |
274 |
356 |
376 |
412 |
16% |
|
Total |
3102 |
3234 |
3367 |
3519 |
3767 |
4147 |
4443 |
5031 |
5504 |
2346 |
2541 |
100% |
1 Includes metered dose inhalers.
Perfluorocarbons
Table 2.8 shows the UK emissions of PFCs reported as Ktonnes C equivalent. It is not currently possible to give emission estimates for individual PFCs because some of these are considered commercially sensitive data within the industries involved. PFCs had limited usage prior to the phase out of CFCs in the electronics and electrical industry. PFCs are now used in:
· etching processes in the semiconductor industry
· chemical vapour deposition in the electronics industry
· soldering processes
· leak testing of electrical components
· cooling electrical components , for example in supercomputers and radar systems.
Other uses include
· refrigerant blended with HFC
· firefighting in specialist applications
· cushioning in the soles of training shoes
Other minor uses of CFCs, which now use PFCs, were in cosmetics and as a tracer gas.
The largest source of PFCs for 2000, representing over half of the total, is from the electronics sector, where emissions arise from the manufacture of semiconductors. PFCs are also formed as a by-product of aluminium smelting. Emission from this sector account for 30% of the UK total in 2000. The emissions are caused by the anode effect which occurs when alumina concentrations become too low in the smelter. This can cause very high electrical current and decomposition of the salt - fluorine bath. The fluorine released reacts with the carbon anode, creating PFC compounds CF4 and C2F6 . Total emissions have declined by 71% since 1990 reflecting steps taken by the industry to reduce emissions.
Table 2.8 UK Emissions of PFCs (Ktonnes C equivalent)
|
|
1990 |
1991 |
1992 |
1993 |
1994 |
1995 |
1996 |
1997 |
1998 |
1999 |
2000 |
2000% |
|
Fire-fighting |
0 |
0 |
0 |
0 |
0 |
0 |
0 |
1 |
1 |
1 |
1 |
1% |
|
Aluminium Production |
554 |
425 |
203 |
129 |
111 |
102 |
81 |
65 |
61 |
57 |
55 |
30% |
|
Refrigeration |
0 |
0 |
0 |
0 |
1 |
2 |
4 |
5 |
7 |
8 |
9 |
5% |
|
Electronics & Training Shoes |
68 |
64 |
58 |
92 |
155 |
194 |
162 |
110 |
109 |
119 |
117 |
64% |
|
Total |
622 |
488 |
262 |
221 |
267 |
298 |
247 |
180 |
178 |
185 |
182 |
100% |
Sulphur Hexafluoride
SF6 is used in the following applications:
· insulation medium in high voltage applications such as switchgear and circuit breakers
· cover gas in magnesium foundries to protect the molten magnesium from re-oxidising when it is cast
· degasser in aluminium casting applications, though its use in the UK is rather limited
· insulating gas in double glazing applications, replacing vacuum as an insulation technique
· plasma etching of polysilicon and nitrite surfaces
· atmospheric tracer for scientific studies
· cushioning in soles of training shoes
Table 2.9 shows the UK emissions of SF6. The largest source is from magnesium manufacture, where SF6 is used as a cover gas. It is not possible to recover the SF6, and hence the total consumption of SF6 is released to atmosphere- emissions from this sector account for 39% of the UK total in 2000. Emissions in 2000 are higher than those in 1990 because SF6 has been increasingly used in place of SO2.
The other main sources are from the manufacture of trainers, and electrical/electronic equipment. The use of SF6 as a cushioning in trainers will be phased out in the near future. Emissions from the electrical insulation arise during the manufacture and filling of electrical switchgear and from leakage and maintenance during the equipment’s lifetime. This application has only been in use for the last 20 to 30 years and little of the equipment has been decommissioned. It is expected that users will take great care over future fluid recovery so that emissions will be minimised. SF6 emissions have increased by 113% since 1990.
Table 2.9 UK Emissions of Sulphur Hexafluoride (tonnes)
|
|
1990 |
1991 |
1992 |
1993 |
1994 |
1995 |
1996 |
1997 |
1998 |
1999 |
2000 |
2000% |
|
SF6 Cover Gas |
20.0 |
20.0 |
20.0 |
20.0 |
25.0 |
25.0 |
30.0 |
30.0 |
25.0 |
25.0 |
25.0 |
39% |
|
Electrical Insulation |
5.3 |
5.6 |
6.0 |
6.3 |
6.4 |
8.4 |
8.9 |
8.2 |
22.0 |
22.7 |
23.5 |
36% |
|
Electronics & Trainers |
0.0 |
1.8 |
3.9 |
5.9 |
8.0 |
10.0 |
10.8 |
11.7 |
12.5 |
13.3 |
14.2 |
22% |
|
Electrical equipment |
5.0 |
5.0 |
5.0 |
5.0 |
5.0 |
4.0 |
3.4 |
3.0 |
2.6 |
2.2 |
1.8 |
3% |
|
Total |
30.3 |
32.5 |
34.8 |
37.2 |
44.4 |
47.4 |
53.2 |
52.8 |
62.1 |
63.2 |
64.4 |
100% |
ACCURACY of emission estimates OF GREENHOUSE GASES
Quantitative estimates of the uncertainties in the greenhouse gas emissions were calculated using direct simulation, a technique similar to Monte Carlo Simulation. This corresponds to the IPCC Tier 2 approach. This work is described in detail by Eggleston et al (1998) though the estimates reported here have been revised to reflect changes in the 2000 Inventory. (Salway et al, 1991)
Table 2.10 Uncertainty of the Emission Inventories
|
Pollutant |
Estimated
Uncertainty % |
|
Carbon Dioxide |
± 2 |
|
Methane |
± 21 |
|
Nitrous Oxide a |
-75% to +264% |
|
HFCs |
± 25 |
|
PFCs |
± 19 |
|
SF6 |
± 13 |
a - Skewed uncertainty distribution.
It should be noted that these uncertainties primarily arise from emission factor uncertainties. Activity data is considered to be more reliable and better characterised. As a result it can be assumed that the trends identified from time series plots are considerably more reliable than an absolute emission total.