6. Comparison with Other Field Intercomparison Exercises
A comparison of the average performance data produced from the 1999 field intercomparison exercise with data from exercises performed in 1994, 1995 and 1998 indicates that the performance characteristics of the laboratories have improved. Table 4 presents the average performance statistics from intercomparisons between 1994 and 1999.
Table 4. Average Laboratory Performance in the UK NO2 Network Field Intercomparison Exercises 1994-1999
|
Average Performance in UK NO2 Network Field Intercomparisons |
||||
|
1994 |
1995 |
1998 |
1999 |
|
|
Average Bias (%) |
-11 |
2 |
1.7 |
-6.7 |
|
Maximum Bias (%) |
118 |
118 |
58 |
24 |
|
Minimum Bias (%) |
-96 |
-87 |
-39 |
-31 |
|
Standard Deviation of Bias |
39 |
39 |
22 |
15 |
|
Precision (ppb) |
2.04 |
0.83 |
2.54 |
2.13 |
Table 4 shows that the performance of participating laboratories has generally improved since 1994. The average bias has increased in magnitude compared with 1998, to -6.7%, however, this may reflect the reduction in the number of laboratories exhibiting large positive bias. The range of bias has reduced, and is illustrated by the gradual reduction in maximum, minimum, and standard deviation in laboratory bias, presented in Table 4.
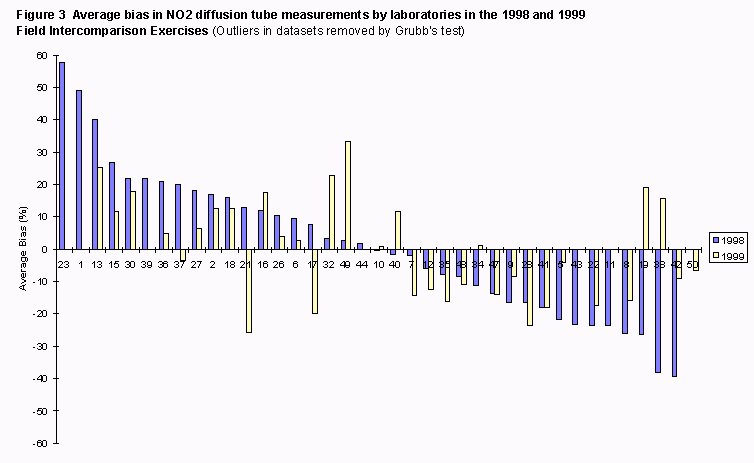
It is also possible to compare the bias in measurements, relative to the average diffusion tube measurement for individual laboratories in the 1998 and 1999 intercomparisons. This is illustrated in Figure 3. Grubb's test has been used to identify outliers in both 1998 and 1999 datasets. Thirty-two laboratories took part in both consecutive years' intercomparisons. The majority (56%) of laboratories exhibited a smaller percentage bias (relative to the average diffusion tube measurement) in 1999 than in 1998.