3. Summary of Results from the Field Testing Exercise
3.1 Comparison with chemiluminescent technique
The average diffusion tube measurement for the period 4th August - 1st September 1999 was 17.7ppb, with a standard deviation of 2.1ppb. The average measurement for the same period, from the co-located chemiluminescent NOx analyser, was 19ppb. Table 1 presents the bias as a percentage for the averaged measurement by a laboratory relative to the average measurement from the automatic chemiluminescent analyser for the same period. Code numbers are used to identify each laboratory. Table 1 shows that only three laboratories exhibited a bias relative to the automatic analyser of greater than the target of ± 25%, and of these three none exceeded this target by more than 6%.
Table 1 Average bias and standard deviation of NO2 diffusion tube measurements, by laboratory
|
Laboratory code |
% Bias relative to automatic analyser 1999 |
Standard Deviation 1999 |
% Bias relative to average diffusion tube conc. 1999 |
% Bias relative to average diffusion tube conc. 1998 |
|
1 |
+49.0 |
|||
|
2 |
+4.9 |
2.76 |
+12.5 |
+16.8 |
|
5 |
-10.6 |
2.97 |
-4.2 |
-21.7 |
|
6 |
-4.3 |
0.28 |
+2.6 |
+9.4 |
|
7 |
-19.9 |
1.67 |
-14.2 |
-1.8 |
|
8 |
-21.5 |
1.69 |
-15.9 |
-26.2 |
|
9 |
-14.6 |
3.51 |
-8.4 |
-16.5 |
|
10 |
-5.9 |
5.09 |
+0.9 |
-0.5 |
|
11 |
-23.6 |
|||
|
12 |
-18.2 |
1.70 |
-12.3 |
-5.9 |
|
13 |
+17.0 |
1.35 |
+25.4 |
+40.2 |
|
15 |
+4.2 |
1.84 |
+11.7 |
+26.7 |
|
16 |
+9.6 |
0.68 |
+17.4 |
+11.8 |
|
17 |
-25.2 |
2.74 |
-19.8 |
+7.6 |
|
18 |
+5.2 |
1.37 |
+12.7 |
+16.0 |
|
19 |
+11.1 |
0.90 |
+19.1 |
-26.3 |
|
21 |
-30.7 |
0.84 |
-25.7 |
+12.8 |
|
22 |
-22.9 |
2.35 |
-17.4 |
-23.5 |
|
23 |
+57.9 |
|||
|
26 |
-3.0 |
1.67 |
+4.0 |
+10.3 |
|
27 |
-0.8 |
2.44 |
+6.4 |
+18.1 |
|
28 |
-28.7 |
2.83 |
-23.5 |
-16.6 |
|
30 |
+10.1 |
1.60 |
+18.0 |
+22.0 |
|
32 |
+14.7 |
3.69 |
+22.9 |
+3.2 |
|
34 |
-5.5 |
3.20 |
+1.3 |
-11.1 |
|
35 |
-21.7 |
1.19 |
-16.1 |
-7.8 |
|
36 |
-2.3 |
1.89 |
+4.7 |
+21.0 |
|
37 |
-10.0 |
0.50 |
-3.5 |
+19.9 |
|
38 |
+7.9 |
3.23 |
+15.6 |
-38.2 |
|
39 |
+21.9 |
|||
|
40 |
+4.2 |
2.58 |
+11.7 |
-1.7 |
|
41 |
-23.7 |
1.25 |
-18.2 |
-18.2 |
|
42 |
-15.3 |
1.14 |
-9.2 |
-39.3 |
|
43 |
-23.2 |
|||
|
44 |
+1.6 |
|||
|
47 |
-19.9 |
3.13 |
-14.1 |
-13.8 |
|
48 |
-17.0 |
3.05 |
-11.0 |
-8.5 |
|
49 |
+24.4 |
2.26 |
+33.4 |
+2.6 |
|
50 |
-12.8 |
2.90 |
-6.6 |
|
|
Average |
-6.7 |
2.13 |
0.0 |
1.2 |
Reference concentration (chemiluminescent automatic analyser) = 19 ppb
Average diffusion tube measurement = 17.7 ppb
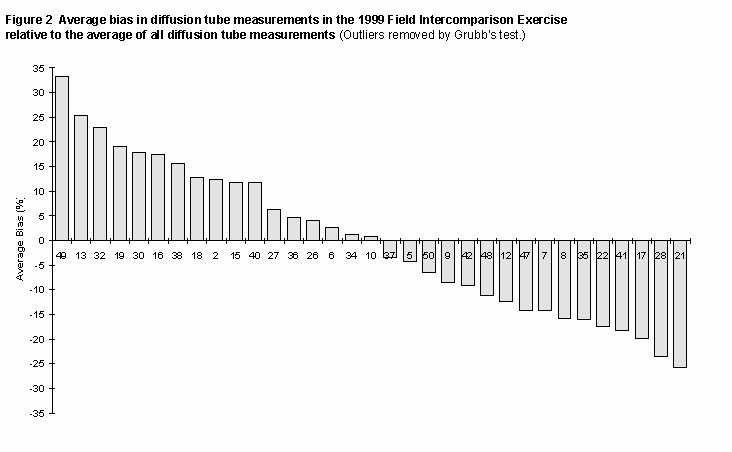
Table 1 also indicates that on average laboratory analyses underestimated by approximately 7% relative to the automatic analyser. This observation is presented graphically by Figure 1, which shows the distribution of bias in averaged laboratory measurements relative to the chemiluminescent analyser. Clearly, the majority of analyses under estimate concentrations relative to the automatic technique. It is also clear that a large proportion of the laboratories exhibiting under reads use diffusion tubes prepared by the same method. This observation will be further discussed in section 4.
The 1998 field intercomparison also identified an average negative bias relative to the automatic method. As explained in the 1998 intercomparison report, historically, diffusion tubes have been shown to over-read, rather than under-read relative to chemiluminescent measurements by up to 30% (Campbell et al)6. Over-read in diffusion tubes may be attributed to the individual and combined effect of three interfering factors:
the shortening of the diffusive path length by wind (Atkins et al)7,
blocking of UV light resulting in reduced NO2 photolysis in the tube (Heal et al)8 and
the effects of PAN (Atkins et al)7.
The only known interference effect which might reduce the amount of NO2 absorbed on to the diffusion tube, is a possible photochemical reaction between the TEA-nitrite complex with light. This effect, however, has been largely minimised by the widespread use of opaque diffusive end caps (Stevenson et al).
In the 1998 field intercomparison, three tubes from each batch were analysed by a standard laboratory; these tubes, in general, showed less negative bias than those analysed by the supplying laboratory. It was concluded that the standard laboratory was achieving better nitrite extraction from exposed diffusion tubes during analysis. As a result, extraction efficiency was identified as a major source of analytical uncertainty in diffusion tubes. The report recommended that all laboratories optimise their extraction techniques, and ensure that a sufficient excess of absorbent is available throughout exposure. On the basis of the data presented on the 1999 field intercomparison, a problem with variable nitrate extraction is still prevalent in a number of laboratories. The recommendation to optimise extraction techniques therefore remains.
3.2 Bias relative to the average diffusion tube measurements
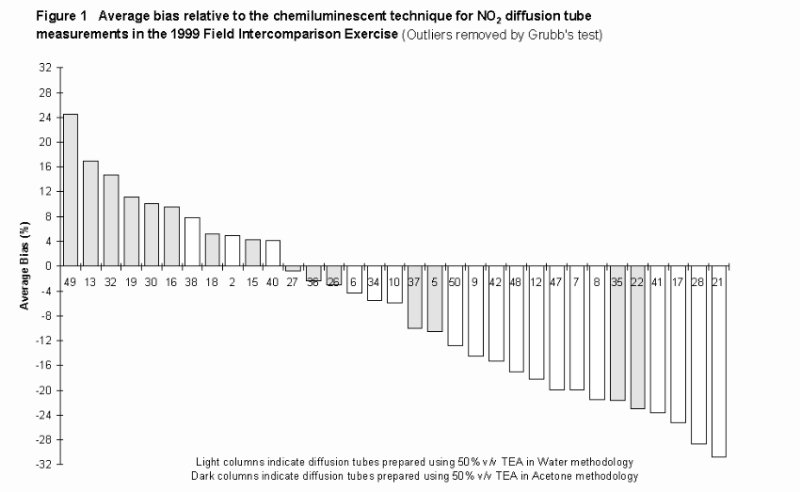
By way of a comparison of laboratory performance in previous intercomparison exercises, Table 1 also presents the average bias in measurements relative to the overall average of all diffusion tube measurements for both 1998 and 1999 field exercises. Outliers have been identified and removed from both datasets using Grubb's test. From Table 1, the overall performance of individual laboratories can be assessed. During the 1999 field intercomparison exercise, measurements from 30 of the 33 laboratories (91%) are within ± 25% of the average diffusion tube measurement. This represents an improvement relative to the 1998 study, where only 79% had an average bias within ± 25%. The range in the average bias exhibited by laboratories in 1999 was similarly less than that identified in 1998; -30.7% to +24.4% in 1999, as opposed to -39% to +58% in 1998. It should be noted, however, that the observed range in bias during 1999 remains unacceptably large. Clearly, further efforts are required in order to reduce this variability to an acceptable level.
The overall distribution of bias in measurements, (relative to the mean of all the measurements) is presented in Figure 2. This plot shows that the distribution bias in the data for each laboratory for August 1999 was close to normal. None of the laboratories show evidence of extreme outlying performance.