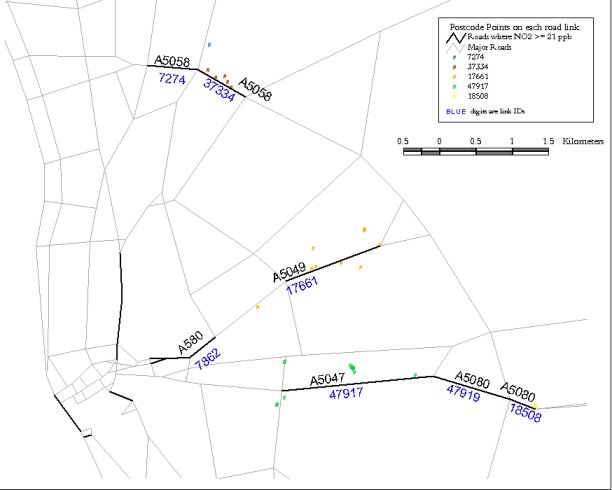
Figure 15 Liverpool:
Locations of road links with modelled annual mean NO
2
concentrations >21 ppb in 2005 (using the national scale model) and building facades within 10 m of the kerb, showing residential postcodes on these road links
Back